Figure 7.
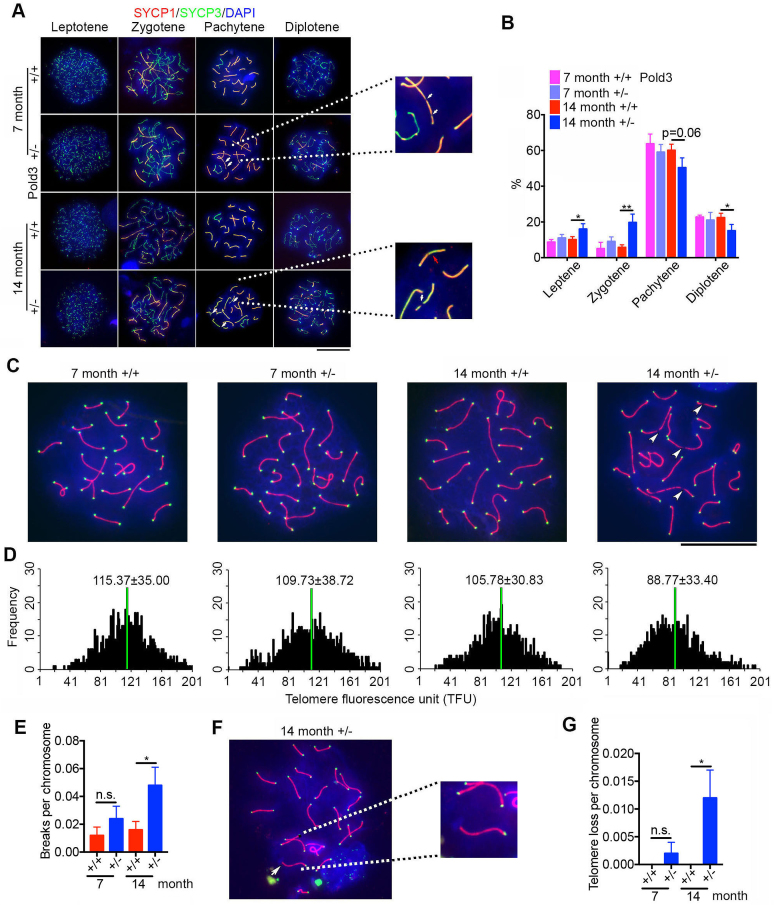
Defective meiosis and telomeres in pachytene spermatocytes of Pold3 heterozygous (Pold3+/−) mice. (A) Meiotic chromosome spreads from Pold3+/+ (WT) and Pold3+/− males were stained with antibody to SYCP1 (red) and SYCP3 (green). (B) Frequency of meiotic prophase I stages. n = 3 mice for each group, and 100 spermatocytes for each mouse. (C) Staining of pachytene spermatocyte spreads by telomere-FISH (green) and immunofluorescence of SYCP3 (red). Chromosome breaks are indicated by white arrowheads. (D) Histogram showing distribution of relative telomere length as TFU by telomere Q-FISH. Black bars on y axis show frequency of telomere signal-free ends. The medium telomere length (green bars) is shown as mean ± SD. About 30 chromosome spreads were quantified for each group. (E) Statistical analysis of chromosome breaks in pachytene spermatocytes. (F) Representative image of telomere loss at the end of chromosome in pachytene spermatocyte, and image of individual chromosome at higher magnification. (G) Frequency of telomere loss per chromosome. Mean ± SEM. *P < 0.05; **P < 0.01.

