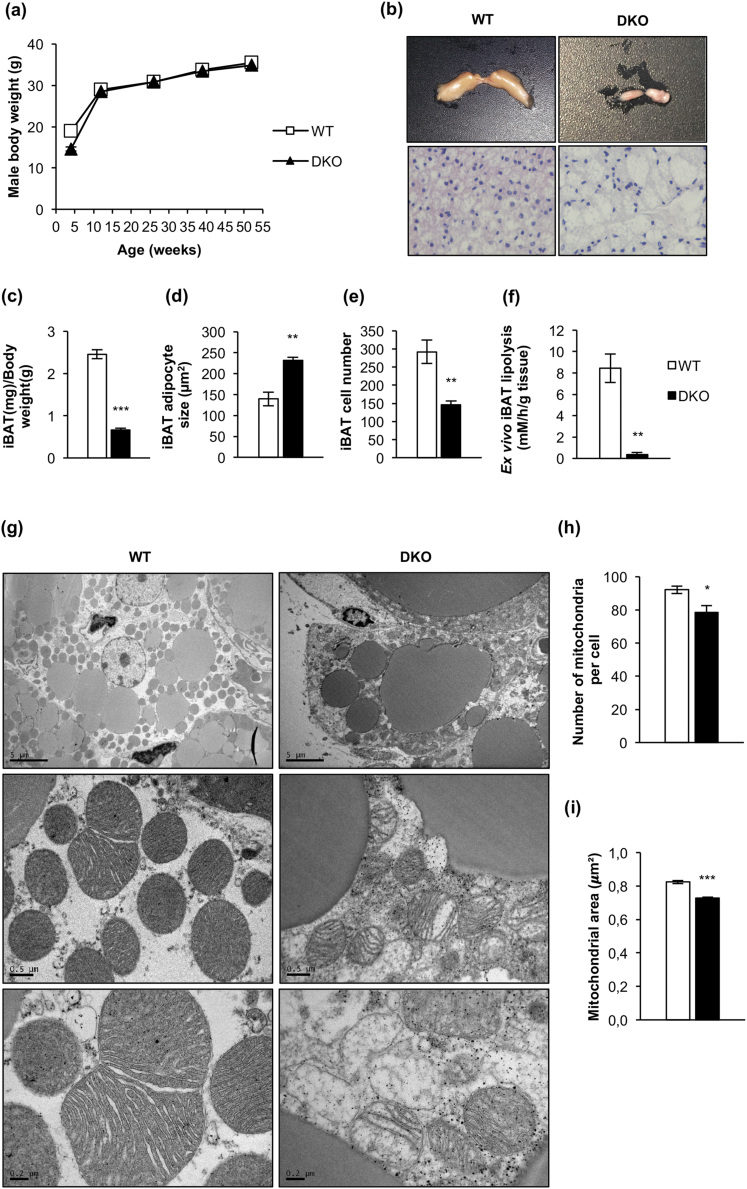
Figure 1.
The lack of IGFIR/IR caused severe brown fat atrophy, loss of mitochondrial mass, and mitochondrial cristae disruption. (a) Body weight of male WT (n = 58/52/24/14/23) and BATIGFIRDKO (n = 61/36/15/10/29) mice fed a standard diet. (b) Representative image of interscapular brown adipose tissue depot in 3-month-old WT and DKO mice (upper panels). Hematoxylin and eosin–stained sections of iBAT from 3-month-old WT (n = 3) and DKO (n = 3) mice (lower panels) (magnification, ×20). (c) Graph indicating the iBAT weight/body weight ratio in 3-month-old WT (n = 15) and DKO (n = 19) mice. (d) Brown adipocyte size (square micrometers) from iBAT compartment is shown in 3-month-old WT (n = 3) and DKO (n = 3) mice (200 adipocytes per group at magnification of ×20). (e) Adipocyte number quantification from iBAT compartment comparing 3-month-old WT (n = 3) and DKO (n = 3) mice (six images per group). (f) Ex vivo iBAT lipolysis experiment comparing WT (n = 5) and DKO (n = 3) mice. (g) Representative electron micrographs from iBAT samples of 3-month-old WT (n = 3) and DKO (n = 3) mice [scale bars: 5 μm (upper panels), 0.5 μm (middle panels), and 0.2 μm (bottom panels)]. (h) Number of mitochondria per cell quantification from 3-month-old WT (n = 3) and DKO (n = 3) mice, with 15 cells per animal. (i) Quantification of mean mitochondrial area (square micrometers) from 3-month-old WT (n = 3) and DKO (n = 3) mice, with 15 cells per animal. All results are presented as mean ± standard error of the mean. Statistical significance was assessed by two-tailed Student t test. For WT vs DKO groups: *P < 0.05; **P < 0.01; ***P < 0.001.

