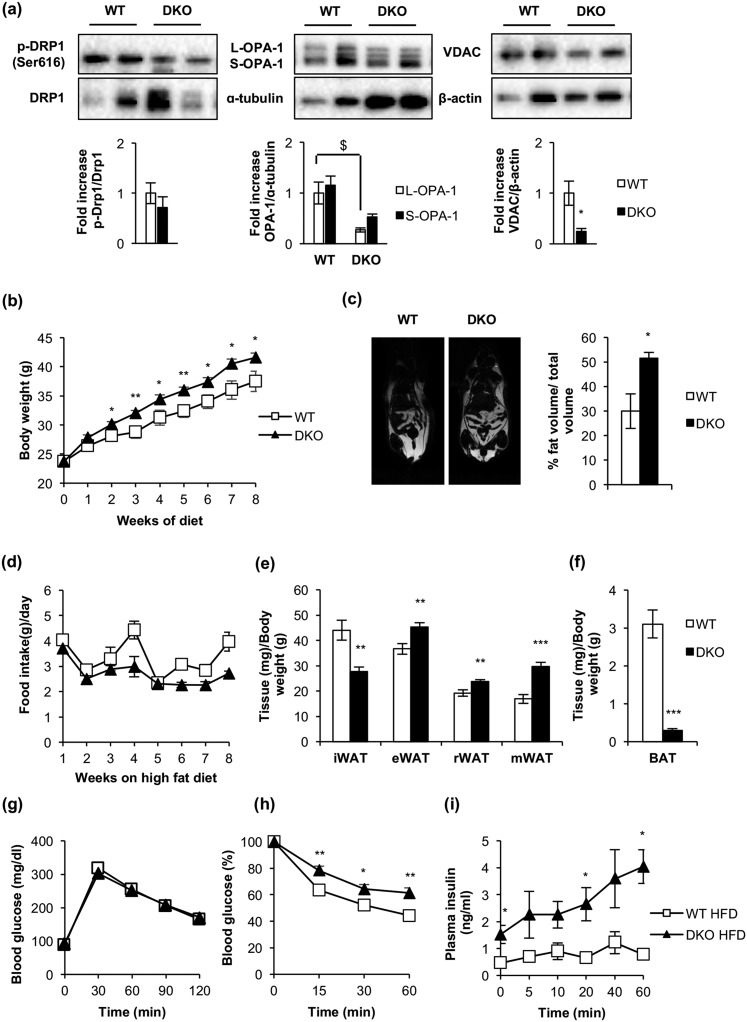
Figure 9.
BATIGFIRDKO progressed into a manifest obesity upon consumption of an HFD. (a) Representative Western blots from iBAT showing different regulators of mitochondrial dynamics comparing 3-month-old WT (OPA-1, n = 3; p-Drp1/Drp1 and VDAC, n = 4) and DKO (OPA-1, n = 3; p-Drp1/Drp1 and VDAC, n = 4) mice fed with HFD for 8 weeks and its corresponding quantitation. (b) Body weight of male WT (n = 8) and DKO (n = 13) mice fed with HFD for 8 weeks. (c) Representative images from NMR comparing WT (n = 2) and DKO (n = 3) mice fed with HFD for 8 weeks. Quantification of NMR images is represented as the percentage of fat volume per total volume. (d) Food intake of WT (n = 3) and DKO (n = 3) mice fed with HFD for 8 weeks. (e) Graph representing the epididymal WAT (eWAT), inguinal WAT (iWAT), retroperitoneal WAT (rWAT), and mesenteric WAT (mWAT) weights per total body weight comparing WT (n = 6) and DKO (n = 8) mice fed with HFD for 8 weeks. (f) Graph indicating the iBAT weight/body weight ratio from WT (n = 6) and DKO (n = 8) mice fed with HFD for 8 weeks. (g) Glucose tolerance test from WT (n = 8) and DKO (n = 11) mice fed with HFD for 8 weeks. (h) Insulin tolerance test from WT (n = 9) and DKO (n = 12) mice fed with HFD for 8 weeks. (i) Insulin plasma levels from WT (n = 6) and DKO (n = 5) mice fed with HFD for 8 weeks. Results are presented as mean ± standard error of the mean. Statistical significance was assessed by two-tailed Student t test; *P < 0.05, **P < 0.01, and ***P < 0.001 between WT and DKO groups. Statistical significance of OPA-1 was assessed by one-way analysis of variance, followed by the Tukey test; $P < 0.05 L-OPA-1 between WT and DKO groups.

