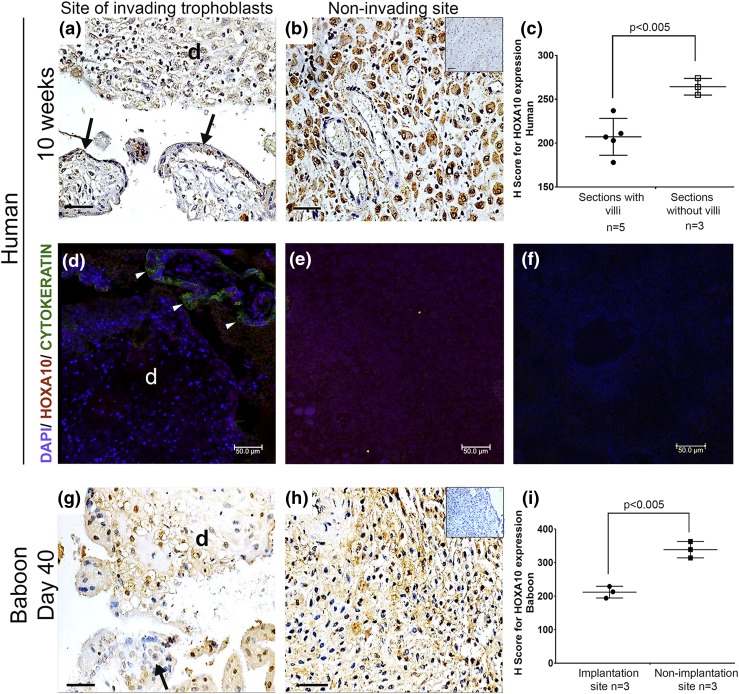
Figure 3.
Differential expression of HOXA10 at implantation and nonimplantation sites in the human and baboon decidua. Immunohistochemistry for HOXA10 in the decidual sections was performed. (a and g) The section of the decidua (marked as “d”) in human and baboon, respectively, at implantation site as judged by the presence of placental villi (marked with arrows). (b and h) The section of the decidua from the nonimplantation site as judged by the absence of placental villi in human and baboon, respectively. Negative control section incubated without primary antibody is shown in the inset of (b). Bar, 50 µm. (c and i) Graphs representing the H-scores for HOXA10 in sections with and without placental villi in humans and implantation and nonimplantation sites in baboons, respectively. (d) Double immunofluorescence for HOXA10 and cytokeratin in human decidua was performed; the nuclei were counterstained with 4′,6-diamidino-2-phenylindole (DAPI). Arrowheads indicate the section where the cytokeratin-positive trophoblast cells in the villi were detected. The decidual tissue is marked as “d.” (e) Decidual section without placental villi. (f) Negative control without primary antibody. In all the graphs, each dot represents one sample, and the mean values that are statistically significant are denoted by bars along with the respective P values. The number of biological replicates analyzed in case is represented as (n).

