Figure 5.
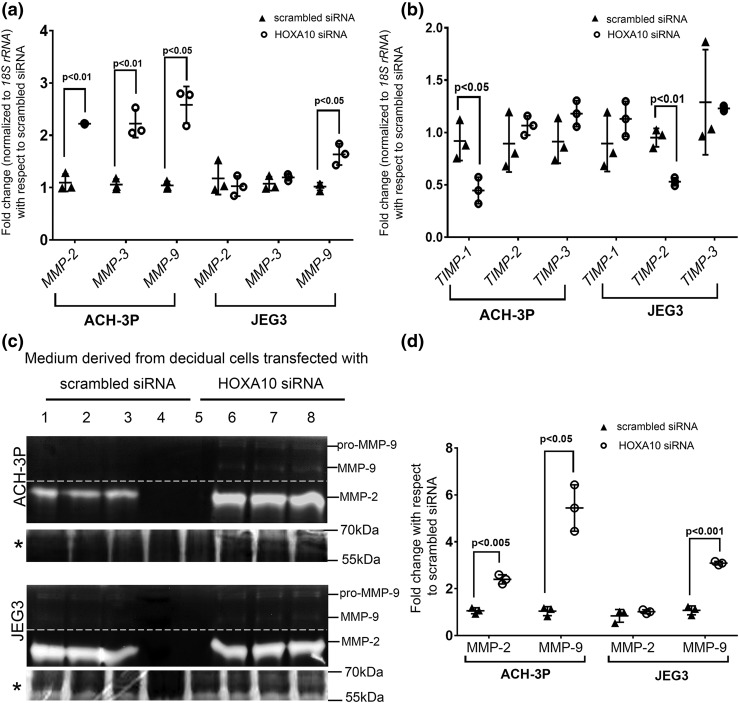
Effects of HOXA10 knockdown in decidual cells on expression of the MMPs and tissue inhibitors of TIMPs in trophoblast cells. Human endometrial stromal cells were decidualized in vitro, and the cells were transfected with siRNA against HOXA10. Cells transfected with scrambled siRNAs were kept as transfection control. The conditioned medium from these cells was collected after 72 hours. ACH-3P and JEG3 cells were challenged with the conditioned medium for 24 hours. Medium was collected to perform zymography, and cells were harvested to extract the RNA. The mRNA levels of (a) MMP-2, -3, and -9 and (b) TIMP-1, -2, and -3 were measured by real-time PCR. Gene expression data are represented as fold change where the control value was taken as 1. (c) Representative image of the gelatin zymogram. Lanes 1, 2, and 3 are supernatants of JEG3/ACH-3P cells challenged with the medium from scrambled siRNA-transfected decidual cells. Lanes 4 and 5 are loaded with heat-inactivated medium. Lanes 6, 7, and 8 are supernatants of JEG3/ACH-3P cells challenged with supernatant obtained from HOXA10 siRNA-transfected decidual cells (each representing three different experiments). The bands for pro- and active MMP-9 and MMP-2 are marked. The dotted line indicates that the contrast was adjusted separately for MMP-9 and MMP-2 bands for visual representation, and the gels were merged. The Coomassie-stained gel image is shown below each zymogram and is denoted by an asterisk. The intensities of the bands were densitometrically analyzed. (d) Activity of active MMP-9 and total MMP-2 as fold change. The value of the control (medium from scrambled siRNA–transfected decidual cells) has been taken as 1. In all the graphs, each dot represents one value. The statistically significant mean values derived from three independent experiments (n = 3) are denoted by bars along with the respective P values.

