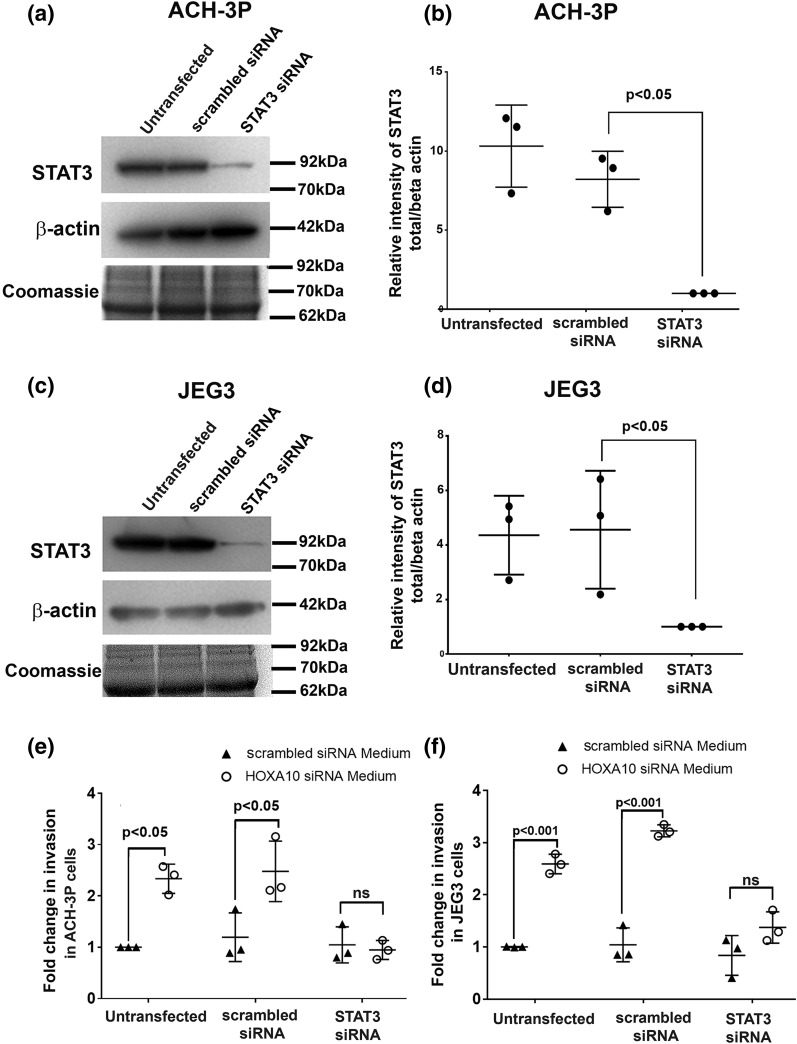
Figure 8.
Effect of STAT3 knockdown on the invasiveness of trophoblast cells in response to conditioned medium from HOXA10 knockdown decidual cells. ACH-3P and JEG3 cells were transfected with scrambled or STAT3 siRNAs. After 48 hours, the amount of total STAT3 was measured by Western blotting. (a and c) Representative Western blots for STAT3 and β-actin along with the Coomassie-stained gel image for total protein. The position of the nearest molecular weight markers is shown next to each image. Band intensities were desitometrically estimated, and values of STAT3 were normalized with respect to β-actin. (b and d) The relative intensity of STAT3 upon normalization after STAT3 silencing in ACH-3P and JEG-3 cells from three independent experiments. Scrambled or STAT3 siRNA–transfected ACH-3P and JEG3 cells were challenged with supernatants derived from scrambled or HOXA10 siRNA–transfected decidual cells, and the invasion was measured after 24 hours of treatment. (d and e) Fold change in invasiveness of cells as compared with nontransfection controls (taken as 1). Data are derived from three independent experiments involving different pools of supernatants from HOXA10-transfected and scrambled siRNA–transfected decidual cells. Each dot represents the value from one experiment. Statistically significant mean values (as compared with controls) derived from independent experiments are denoted by bars along with the respective P values. ns, not significant.

