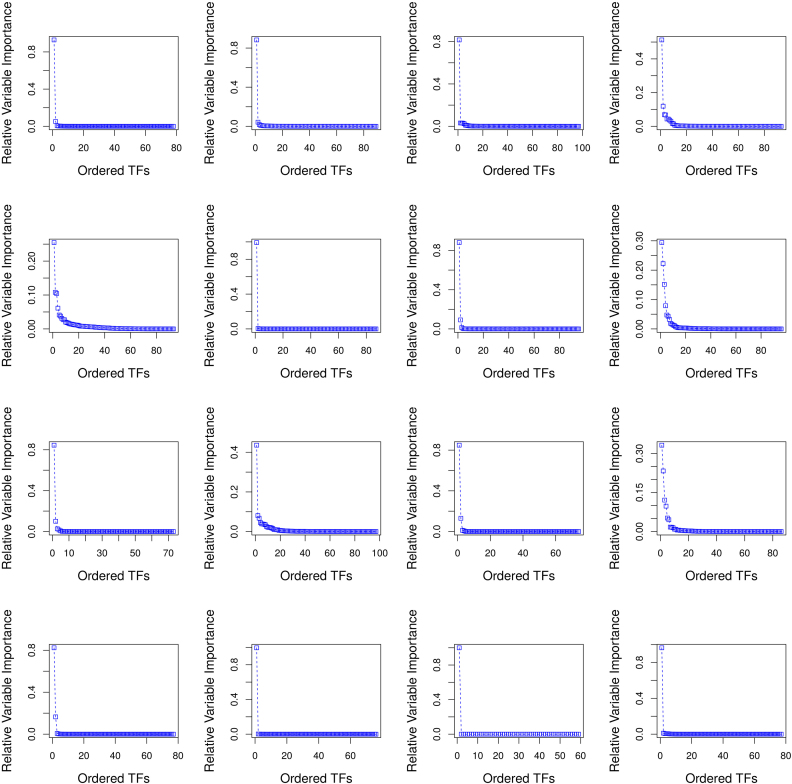
Figure 2.
Sorted RVI score curves for the first 16 targets of Network 1 from DREAM4 challenge. The target genes are ordered in row-format from left to right (i.e. 1–4 target genes in row 1, 5–8 target genes in row 2, etc.) We can empirically observe that the sorted RVI curves ≈ follows an exponential distribution w.r.t. the number of TFs for each target gene. This is further verified by a near linear fit to the log (RVI) scores w.r.t. the set of TFs as showcased in Supplementary Figure S4. Thus, there are only a few TFs which are strongly regulating the expression of a target gene.

