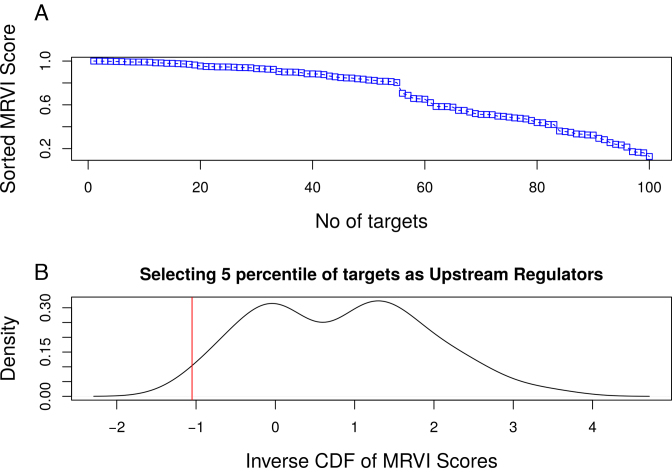
Figure 4.
Subfigure A represents the MRVI score distribution for all the 100 targets of Network 1 from DREAM4 challenge. Subfigure B corresponds to inverse cumulative density function of the MRVI scores (IMRVI). Here the ‘red’ vertical line represents the heuristic cut-off ρ s.t. all targets whose MRVI score is less than ρ are selected as 0 in-degree genes and correspond to 5 percentile of the distribution.

