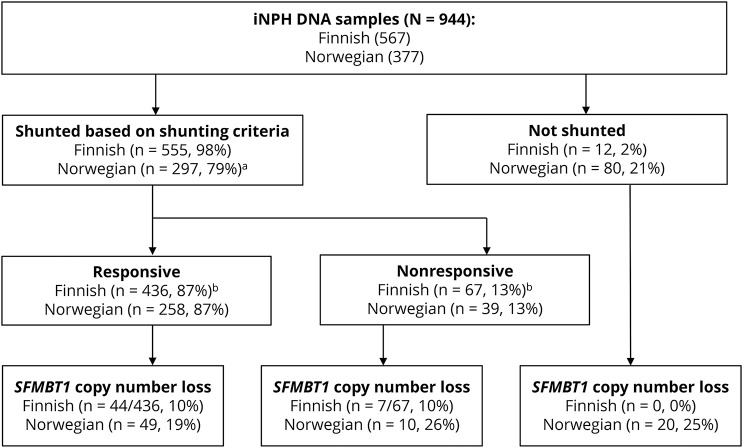
Figure 1. Flowchart of the study cohort.
Flowchart showing the Finnish and Norwegian cohorts. No difference was detected between the frequency of the genetic variant between shunt-responsive and nonresponsive patients in either Finnish (OR = 1.0, CI 95% 0.44–2.4, p = 0.93) or Norwegian (OR = 0.68, CI 95% 0.31–1.5, p = 0.33) cohort. aLost to follow-up (n = 7). bLost to follow-up response (n = 63). CI = confidence interval; OR = odds ratio.

