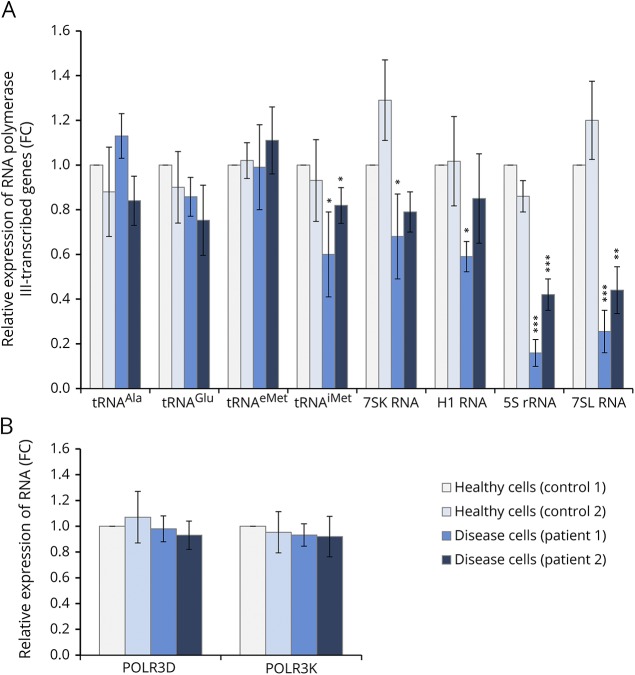
Figure 3. RNA levels determined by RT-qPCR analysis.
Total RNAs were isolated from healthy (control cells) or POLR3K mutated (disease cells) patients' fibroblasts. Relative gene expression levels were normalized with β-actin and PPIA genes as an internal control and compared with control cells. Each bar represents the mean ± SD of at least 3 independent experiments. *Indicated a significant difference of disease cells compared with healthy cells. *p < 0.05, **p < 0.01, ***p < 0.001. (A) POLR3K and POLR3D mRNA expression levels. (B) Expression of RNA polymerase III–transcribed genes.

