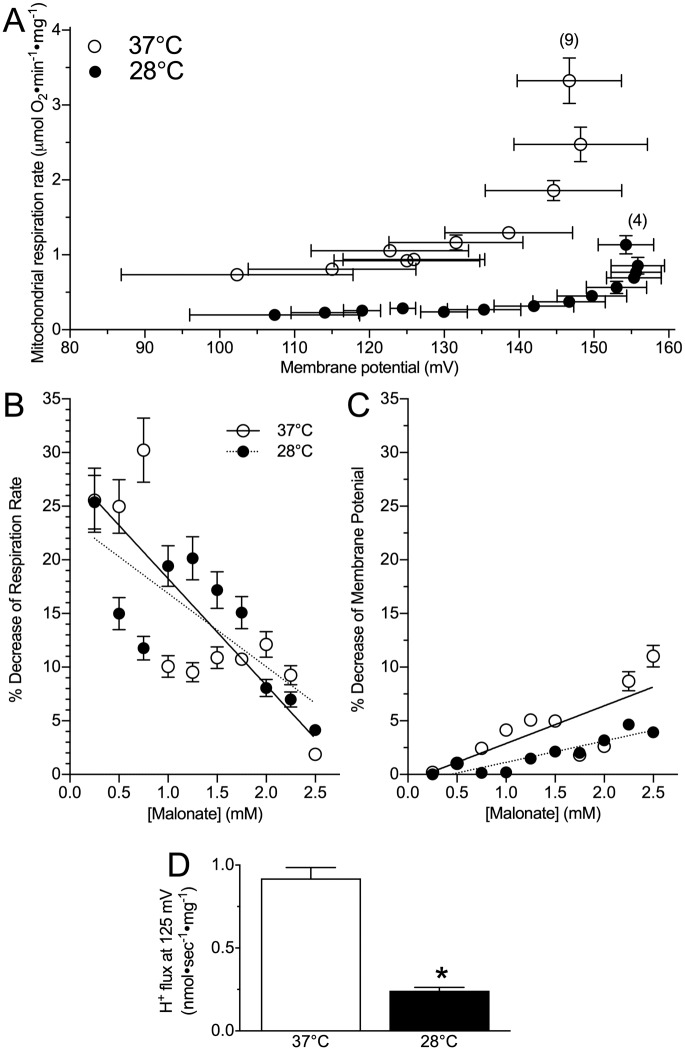
Fig 3. The mitochondrial H+ gradient of hypothermic brain mitochondria is reduced relative to physiological temperature.
(A) Hypothermic (black circles) brain H+ flux and oxygen consumption are equally coupled but reduced in magnitude relative to at physiological temperature (open circles). (B) Percent decrease of mitochondrial respiration, and (C) mitochondrial membrane potential with step-wise addition of malonate. (D) Comparison of H+ flux rates at a common mitochondrial membrane potential of 125 mV. The temperature co-efficient (Q10) for H+ flux at 125 mV is 4.4. Data are mean ± SEM. Numbers in parenthesis indicate n. Asterisks (*) indicate significant differences between mice and NMR mitochondria (p < 0.05; see Results section for statistical tests).

