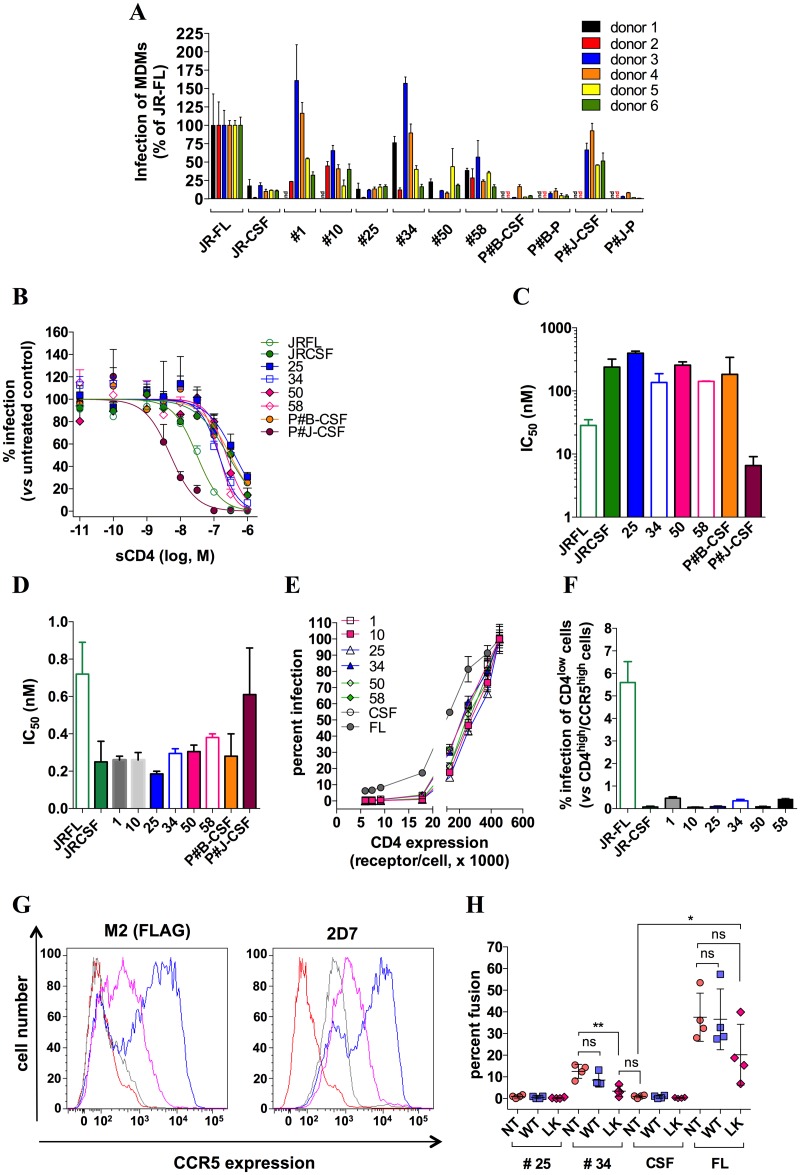
Fig 6. Blood-derived HIV-1 isolates depend on CCR5 plasticity for infection of MDMs.
A MDMs from 6 different healthy donors were infected by virus clones pseudotyped with gp160 #1, #10, #25, #34, #50 or #58, the M-tropic or the non-M-tropic HIV-1 strain JR-FL or JR-CSF, respectively, or recombinant viral populations generated from plasma (P) or cerebrospinal fluid (CSF) of two patients with HIV-1-associated encephalitis (P#B and P#J). Virus quantities that produced comparable levels of infectivity in T-cells isolated from the same donors (i.e. 105 RLU) were used. Of note, similar results were obtained after normalizing the virus quantities to the p24 content. Results represent infectivities of the viruses in MDMs, determined in duplicate, and normalized to infectivity of JR-FL (arbitrarily set at 100%). B Sensitivity of viruses to sCD4. Some of the previous viruses were tested for their sensitivity to inhibition by increasing concentrations of sCD4 in infection experiments of PHA/IL-2- activated CD4 T-cells. The virus amounts were selected in such a way that infectivities in the absence of sCD4 were similar (i.e. 105 RLU of luciferase activity). The data points shown are from one representative experiment performed in duplicate, out of three experiments performed independently. The independent experiments were carried out with the lymphocytes from different healthy donors. Infectivity of the viruses was expressed as percentage of that measured in the absence of sCD4 (100%). Inhibition curves were fitted according to a sigmoidal dose-response model with a variable slope. C The panel shows sCD4 IC50 values that were deduced from inhibition curves with GraphPad Prism 6. Results are means ± SD of 3 independent determinations. D Dose-response inhibitions of infection of activated CD4 T-cells by increasing concentrations (ranging between 10−12 and 3x10⁻⁸ nM) of the anti-CD4 mAb Q4120 were carried out with the indicated viruses. Then, IC50 values for inhibition of infection by Q4120 were calculated with GraphPad Prism 6. The data shown here represent means ± SEM of two independent experiments performed in duplicate. E Infection assays of Affinofile cells expressing CCR5 at a high level (≈ 105 receptors/cell, stimulated by 2 μM ponasterone A) and increasing amounts of CD4 stimulated by 7 different concentrations of minocycline ranging between 0.08 and 2.5 ng/ml (see “Materials and methods” for further details). Data points represent infectivities of viruses that were normalized to infectivity in Affinofile cells expressing the highest levels of CCR5 and CD4 (CD4high/CCR5high Affinofile cells), arbitrarily taken as 100%. One representative experiment out of three independent experiments performed in duplicate is shown. In those experiments, the quantities of the different viruses were adjusted in such a way that they generated similar RLU in CD4high/CCR5high Affinofile cells (105). However, similar results were also obtained when normalizing the quantities of viruses to the p24 content. F Infectivities of the indicated pseudotyped viruses in CD4low/CCR5high affinofile cells (cells that have not been stimulated by minocycline, and where the CD4 expression level is minimal, i.e. in the range of 4000 receptors/cell), expressed as percentage of the infectivity in CD4high/CCR5high Affinofile cells). G Receptor expression levels at the surface of untransduced (grey line) or transduced MDMs with pTRIP ΔU3-expressing FLAG-tagged WT-CCR5 (blue line) or L196K-CCR5 (magenta line). Results were obtained using the anti-Flag mAb M2 (left panel) or the anti-CCR5 mAb 2D7 (right panel) revealed by an AlexaFluor 647-conjugated goat anti-mouse IgG (GAM) and flow cytometry analysis. With the mAb M2, GMFI values equal to 7836 and 2010 were found for WT-CCR5 and L196K-CCR5. Background signal of untransduced MDMs labeled with GAM alone is represented as red lines. H Levels of fusion of BlaM-vpr-containing virus #25, virus #34, JR-CSF or JR-FL to untransduced or transduced MDMs. Fusion was measured by flow cytometry analysis 3 h post-inoculation, as described in the “Materials and Methods” section. Each data point represents the level of fusion of the indicated virus clone with MDMs from one donor, expressed as a percentage of MDMs where CCF2 is cleaved by BlaM. On the whole, four independent experiments with MDMs from four healthy individuals were done. The panel displays the means +/- SD of the results obtained from these 4 experiments.

