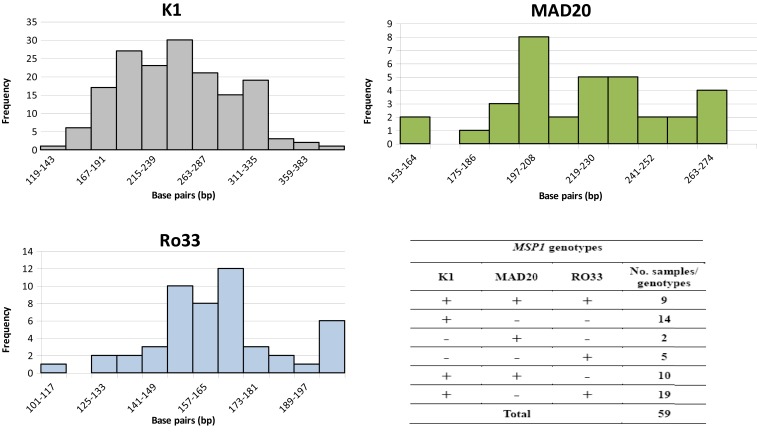
Figure 1.
Size variant allele frequency for each allelic family observed in the analyzed samples and number of samples harboring each MSP1 allelic family. For K1, the mean size ± SE of PCR fragments was 247 base pairs (bp) ± 4 bp, K-S D statistic = 0.18, P = n.s.; for MAD20, the mean size ± SE was 222 bp ± 5 bp, K-S D statistic = 0.22, P = n.s.; and for RO33, the mean size ± SE was 165 bp ± 3 bp, K-S D statistic = 0.23, P = n.s. This figure appears in color at www.ajtmh.org.

