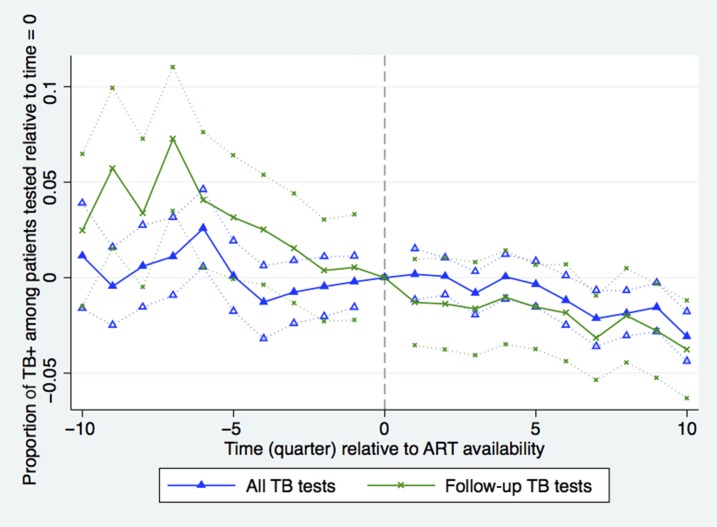
Figure 3.
Proportion of tuberculosis (TB)-positive patients among patients tested for TB during quarters before (δ coefficients from equation 1) and after (γ coefficients from equation 1) antiretroviral therapy (ART) introduction relative to time = 0. Time (quarter) is calculated as quarter of observation minus quarter of ART introduction. Dotted lines indicate facility-clustered, heteroskedasticity-robust 95% confidence intervals (All TB tests N = 10,039, time 0 = 24%; Repeat TB tests N = 5,098, time 0 = 30%). This figure appears in color at www.ajtmh.org.

