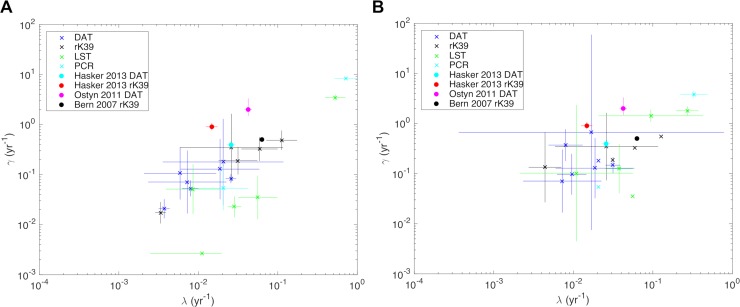
Fig 5.
Estimated conversion and reversion rates, λ and γ, from (A) age-independent (λ = b0 = constant) and (B) age-dependent (λ = b0 + b1 × age) reversible catalytic models for the age-prevalence distributions of infection for the different studies in Table 3. Crosses show the maximum likelihood estimates for (λ,γ) for each study, dots (λ,γ) estimates from longitudinal studies [23,24,50], and lines their 95% confidence intervals. λ estimates in (B) are at age 20yrs (i.e. λ = b0 + 20b1).

