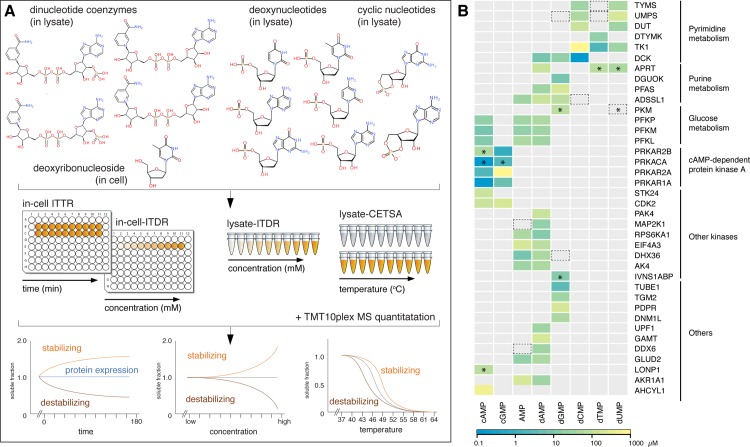
Fig 1. Optimized CETSA workflow for profiling protein-nucleotide interactions in whole cell and lysate conditions, and relative affinities and specificities of the eight nucleotides for their identified hit proteins in lysate-ITDR experiments.
(A) ITDR and melt curves workflows were applied to lysate experiments and in-cell ITDR and ITTR to whole cell experiments as a proxy for tracking the uptake and conversion of metabolite precursors in vitro. (B) Colour scale represents the minimal dose threshold (MDT) (μM) of the isothermal dose response at 52°C, with the lowest MDT (therefore higher relative affinity) in blue and the highest MDT (therefore lower relative affinity) in yellow. Hit proteins are grouped according to their associated biochemical pathways and function (black lines). Asterisks (*) indicate destabilizing hits. Black dotted boxes indicate proteins with similar ITDR responses that did not meet the hit selection criteria.

