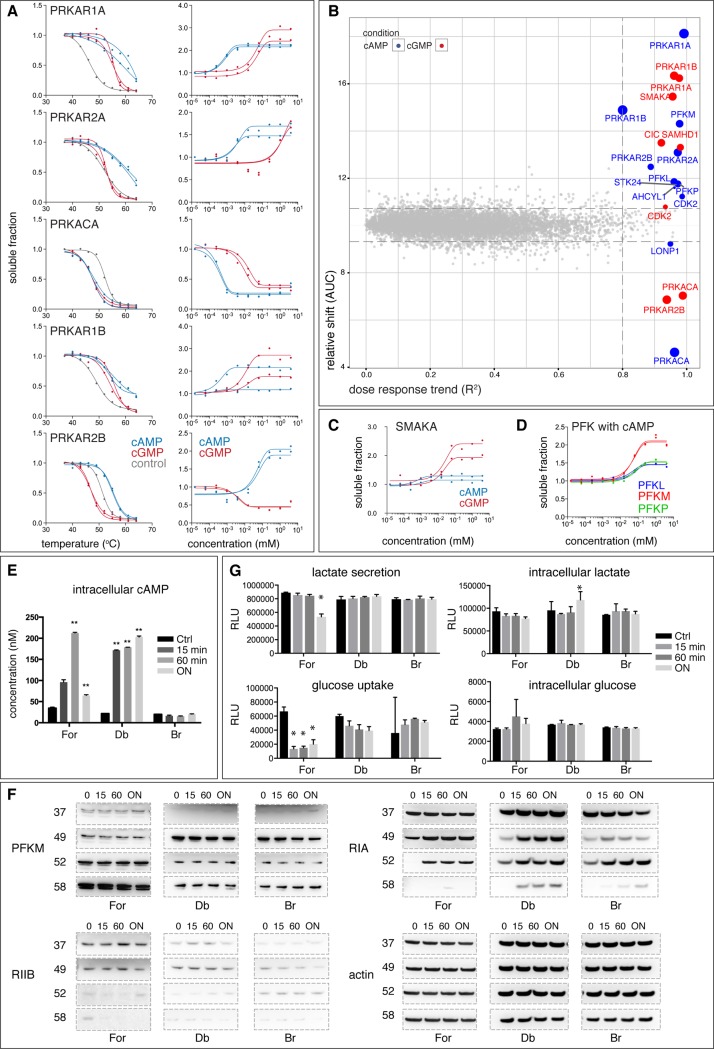
Fig 2. CETSA shifts and ITDRCETSA with cAMP and cGMP in K562 lysates.
(A) CETSA shifts (left) and ITDRCETSA (right) for subunits of cAMP-dependent protein kinase A (PKA) (regulatory: PRKAR1A, PRKAR2A, PRKAR1B, PRKAR2B and catalytic PRKACA), with cAMP (blue), cGMP (red) and control untreated CETSA curves (grey) measured in K562 cell lysates. (B) ITDRCETSA hit plot with AUC (area under the curve) versus R2 plot of ITDRCETSA curves from cAMP/cGMP-treated conditions. Each dot represents the average AUC (relative thermal shift) and R2 ITDRCETSA (dose response trend) measurements per protein from two replicates. The size of the dot negatively correlates with the MDT. (C) ITDRCETSA for small membrane A-kinase anchor protein (SMAKA) with cAMP and cGMP. Colors as in Fig 2A. (D) ITDRCETSA for homologs of phosphofructokinase (PFK)—PFKM (muscle), PFKL (liver), PFKP (platelet) with cAMP. Data is presented as two individual technical replicates for each protein. Cells were stimulated for the indicated durations (0, 15, 60 mins and overnight (ON)) with 0.5 mM of forskolin (For), 2 mM of Db-cAMP (Db) or Br-cAMP (Br), the samples were used to measure (E) cAMP level in lysates, (F) target engagement using CETSA-western blot for PFKM, RIA, RIIB and actin, and (G) lactate secretion, glucose uptake, intracellular lactate and glucose levels. RLU: relative luminescence units. * <0.05, **, <0.01, two-tailed t-test.

