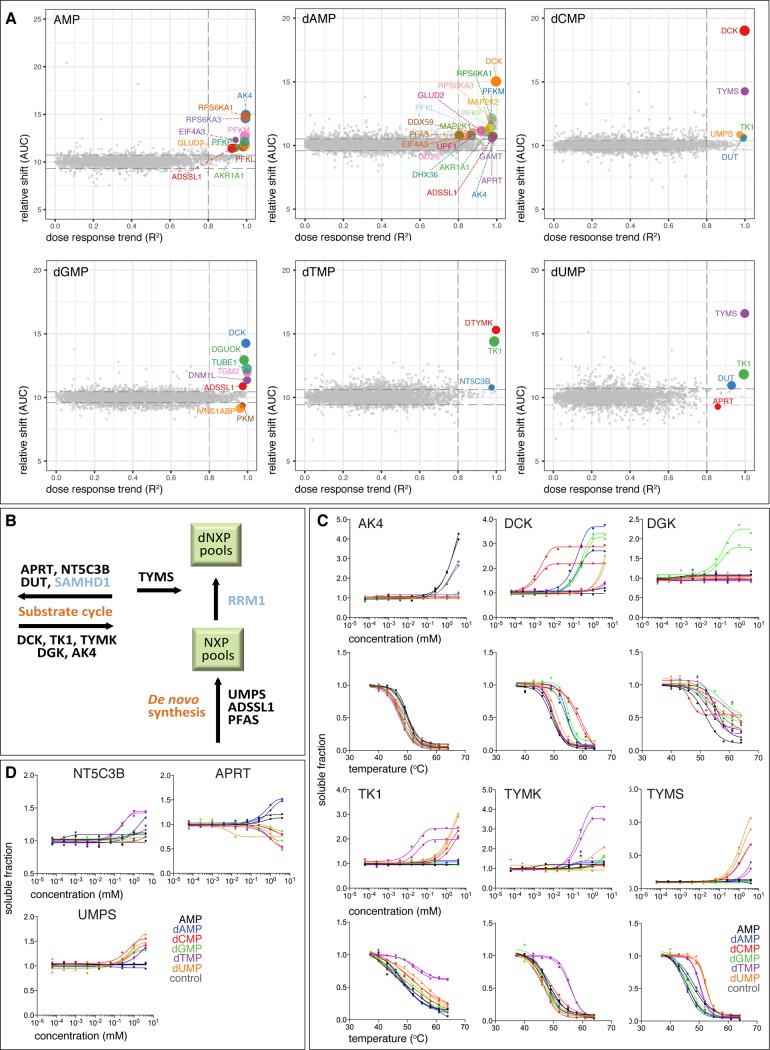
Fig 3. Protein hits from lysate CETSA with deoxynucleotides.
(A) ITDRCETSA hit plot with AUC versus R2 plot of ITDRCETSA curves after lysate treatment with AMP, dAMP, dCMP, dGMP, dTMP, and dUMP. Each dot represents the average AUC (relative thermal shift) and R2 ITDRCETSA (dose response trend) measurements per protein from two replicates. The size of the dot negatively correlates with the MDT. (B) Schematic of the proteins in the core nucleotide metabolism responding to the five deoxynucleotides and AMP. SAMHD1 and RRM1 were hits in the in-cell ITDRCETSA experiment (Fig 5). (C) ITDRCETSA (top) and CETSA curves (bottom) with the dNMPs for enzymes involved in the deoxypyrimidine salvage and synthesis pathways; adenylate kinase 4 (AK4), deoxycytidine kinase (DCK), deoxyguanosine kinase (DGK), thymidine kinase (TK1), thymidylate kinase (TYMK) and thymidylate synthase (TYMS). Data is presented as two individual technical replicates for each condition from one representative experiment. (D) Other protein hits from dNMPs-ITDRCETSA involved in the nucleotide metabolism: 7-methylguanosine specific 5’-nucleotidase (NT5C3B), adenine phosphoribosyltransferase (APRT) and UMP synthase (UMPS). Data is presented as two individual technical replicates for each condition from one representative experiment.

