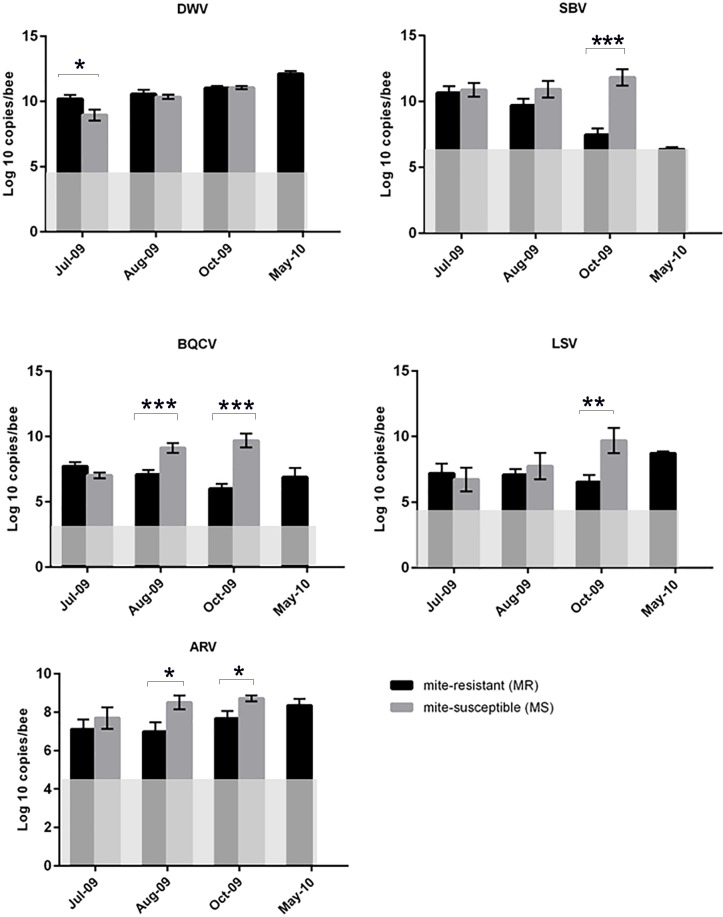
Fig 3. RT-qPCR data of major bee viruses.
Virus titres in the 2009–2010 season for colonies in the MR and MS honeybee populations. Data are presented on a logarithmic scale for DWV, SBV, BQCV, LSV and ARV-1. Error bars indicate the standard deviation at each time-point. The opaque area in each graph (May-2010 for DWV, BQCV, SBV, and all seasons for LSV and ARV) represents the RT-qPCR detection threshold. The data for DWV, SBV, and BQCV for 2009 is from our previous study [32]. The corresponding data for 2010 and all data for LSV and ARV-1 is new. The asterisks indicate statistically significant differences, as determined by Welch’s t-test (* = P < 0.05, ** = P < 0.01, *** = P < 0.001).

