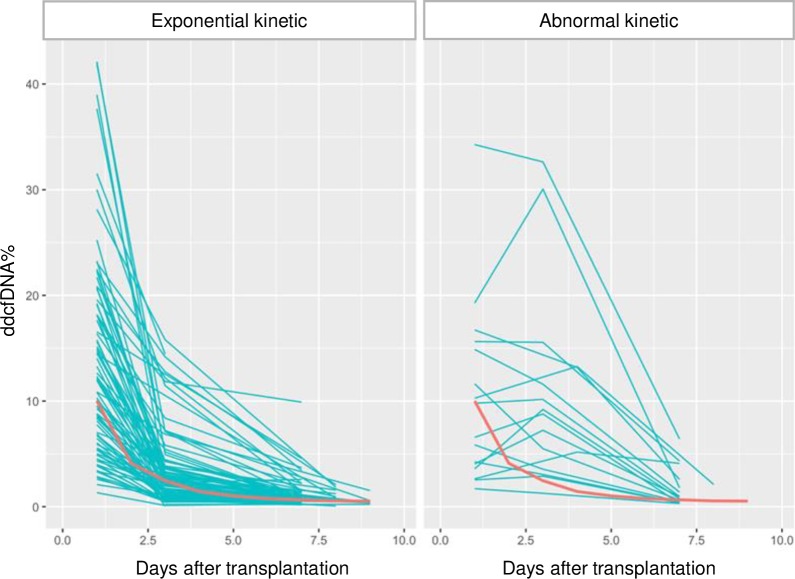
Fig 4. Fit ddcfDNA% curves from all kidney transplant recipients.
Fit ddcfDNA% curves from all kidney transplant recipients (exponential kinetic: n = 90; abnormal kinetic: n = 16) during the unstable post-transplantation phase before day 10. One recipient was excluded because of a lack of sufficient samples to define the ddcfDNA% kinetic. The reference median fit curve of the subgroup of stable renal transplant recipients is shown in red in both graphs. ddcfDNA: donor-derived cell-free DNA.

