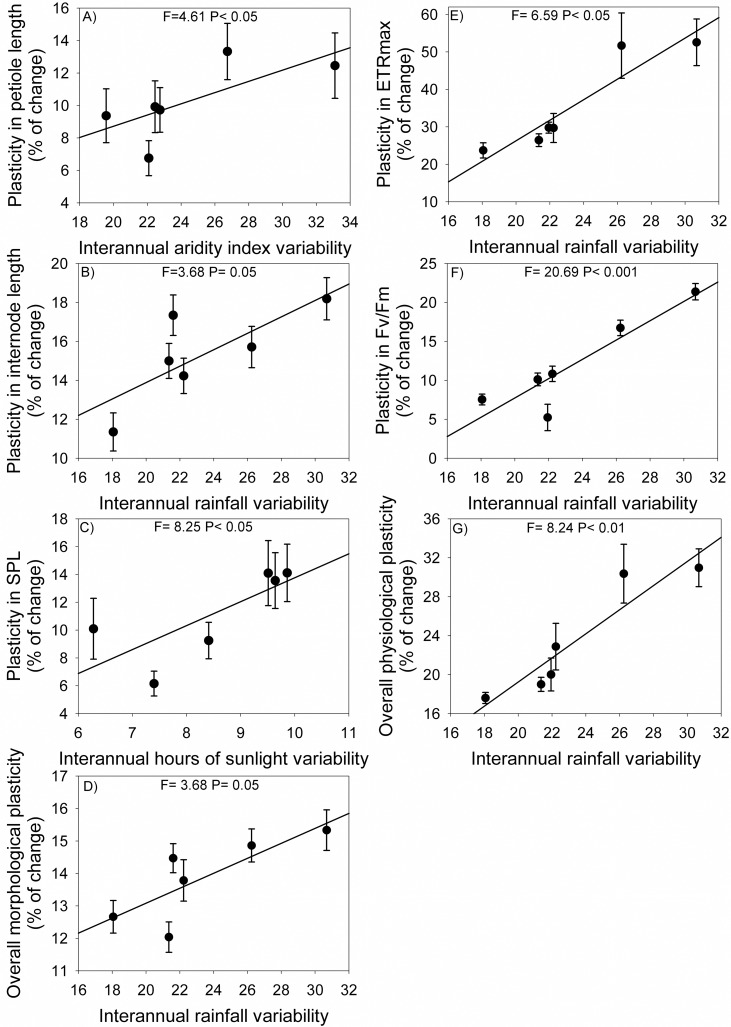
Fig 4.
Relationship between trait phenotypic plasticity and interannual variation in climatic variables in populations of Copaifera langsdorffii for: A) petiole length; B) internode length; C) SPL, specific petiole length; D) overall morphological plasticity (measured as the arithmetic mean of the percentage of change for all morphological traits); E) ETRmax, maximal electron transport rate; F) Fv/Fm, potential quantum yield of photosystem II; G) overall physiological plasticity (measured as the arithmetic mean of the percentage of change for all physiological traits). Average values and SE of each population are shown (for morphological traits N = 112 and physiological traits N = 18).

