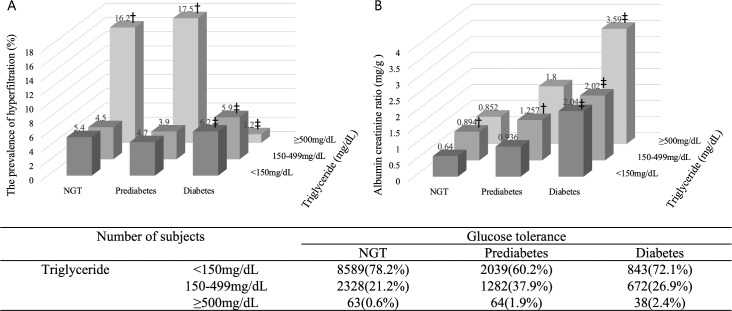
Fig 2. Prevalence of hyperfiltration by serum triglyceride level and diabetes status after adjusting for clinical and metabolic parameters*.
NGT, normal glucose tolerance. * age, sex, body weight, body mass index, waist circumference, systolic blood pressure, and energy intake. † P<0.05 vs. a serum triglyceride level <150 mg/dL (Bonferroni method). ‡ P<0.05 vs. Normal glucose tolerance (Bonferroni method).

