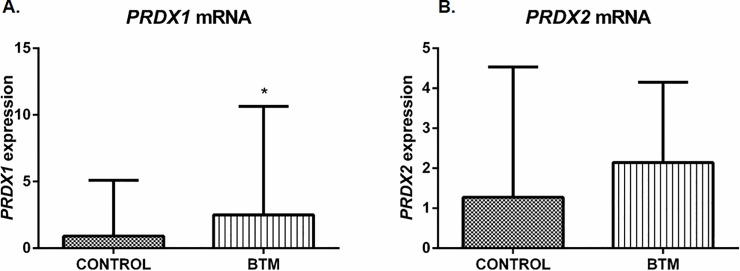
Fig 4. Transcription analysis of Prdx1 and Prdx2 gene expression in reticulocytes of BTI and BTM patients.
RT-qPCR was carried out using the primers for each gene as described in S1 Table. mRNA abundance for each gene was normalized to Bac as endogenous reference. Results are presented as mean and standard error (± SEM). Statistical significance: *p < 0.05.

