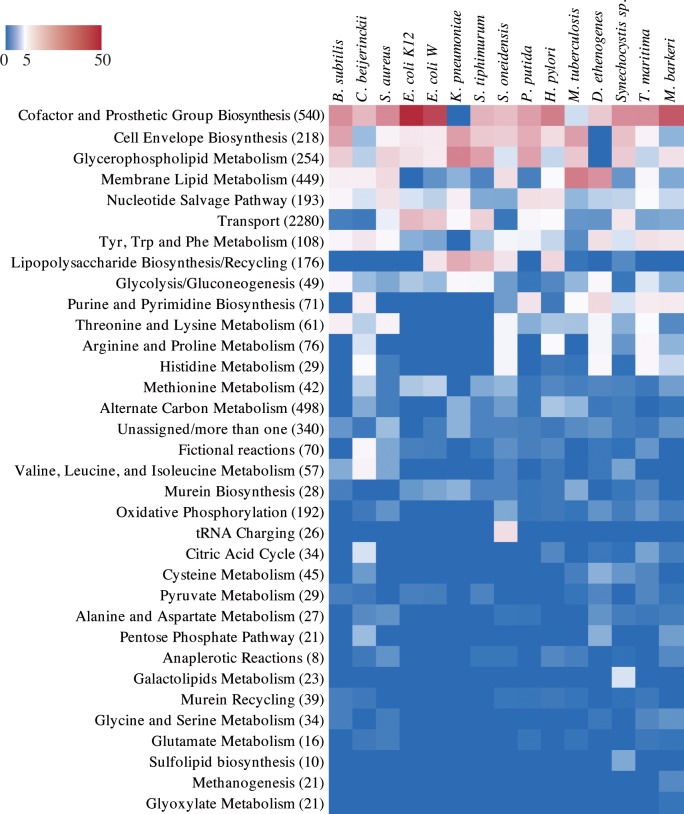
Fig 2. Essentiality for biomass production of each metabolic subsystem in 15 genome-scale manually curated metabolic models.
The colour bar represents the ratio of essential reactions (in that subsystem) to the total of essential reactions in each model (0%—blue; 5%—white; 50%—red). In parenthesis next to the subsystem name is the total of reactions in that subsystem (for all models).

