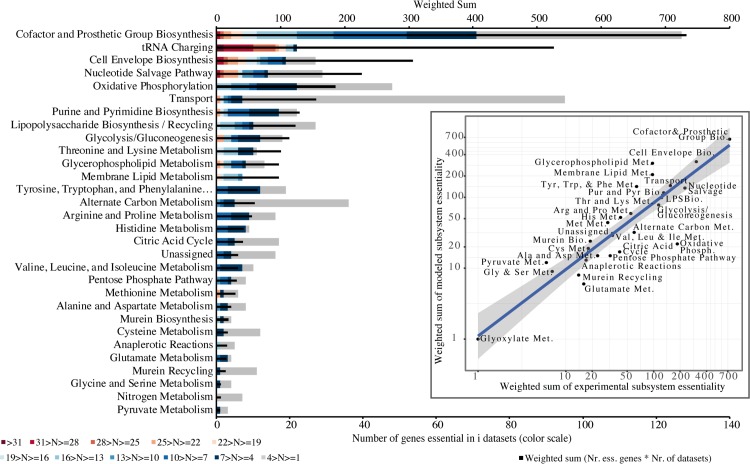
Fig 4. Conservation of essentiality of metabolic subsystems in 36 large-scale gene essentiality datasets and correlation with modelling predictions (inset).
Red indicates highest conservation (genes essential in more than 31 datasets) and grey the least (essential in less than 4 datasets); black bar: weighted sum of essential genes given the number of datasets in which they are essential (see Methods). Inset plot: Correlation between modelling and experimental genome-scale essentiality data at subsystem level (adjusted R2 of 0.821, Pearson correlation coefficient of 0.909 with p-value 9.65e-14); axes are represented in log scale for visualization purposes only.

