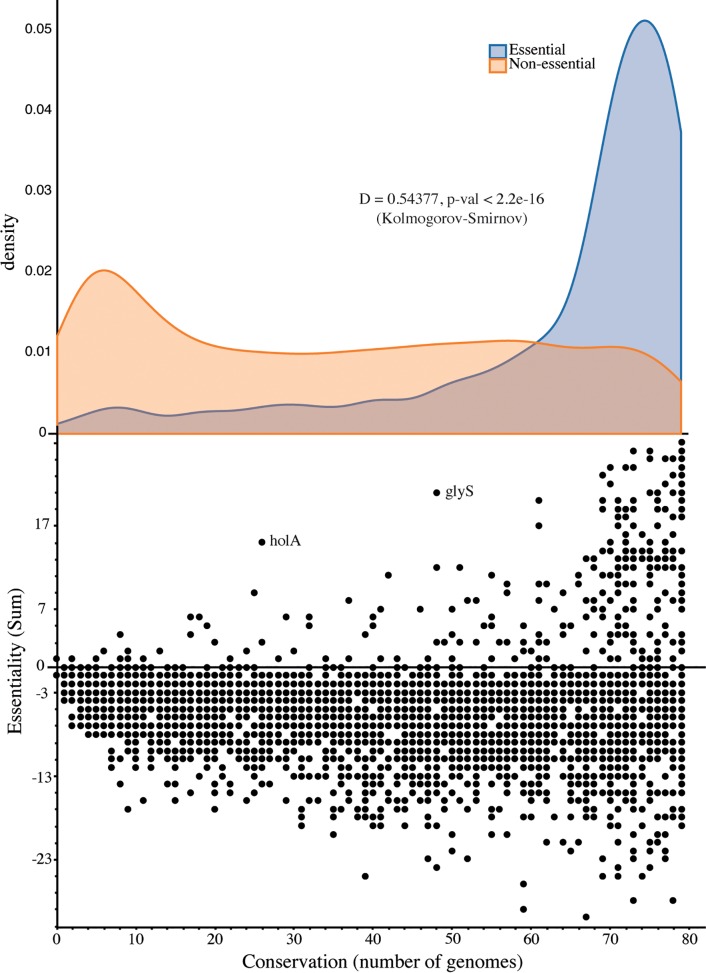
Fig 6. Conservation and essentiality of protein-encoding genes.
Conservation is calculated as the number of genomes where a gene is present and essentiality as the number of datasets where a gene is essential minus the datasets where it is non-essential. The full list of genes is given in S3 File. In the bottom panel, all data is plotted, with conservation on the x axis and essentiality on the y axis. The top panel depicts the density distribution of the conservation of genes (on the shared x axis) with a sum of essentiality larger than 0 –blue–and that of the genes with a sum of essentiality equal or smaller than 0 –orange. The results of a Kolmogorov–Smirnov test for the independence of both distributions are shown, D for the value of the test statistic and the p-value of the test.

