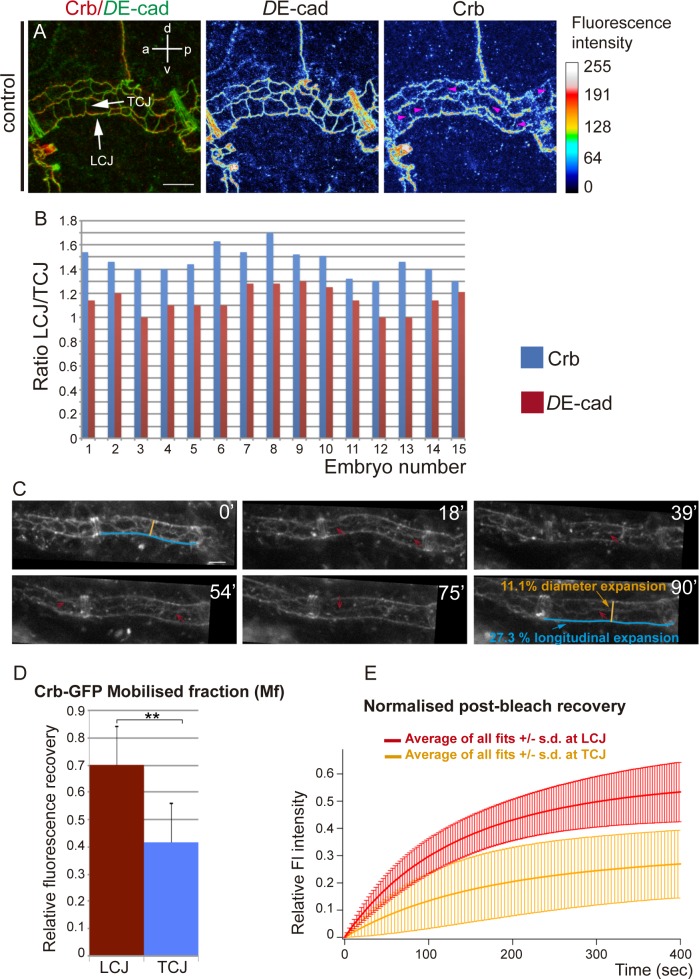
Fig 1. Anisotropic accumulation of Crb during tube elongation.
(A) Confocal projection of a metamere of the DT of a stage 16 embryo stained for DE-cad and Crb. The fluorescence intensity of DE-cad and Crb is shown in heat maps. The fluorescence intensity values mapped to the gradient bar to the right ranging from black (0) to white (255). The gradient bar was generated with the “calibration bar” tool in ImageJ. Note that while DE-cad shows similar fluorescence intensity at longitudinal and transverse cell junctions (LCJs and TCJs respectively, white arrows), Crb fluorescence intensity is higher at LCJs. Crb accumulation at many TCJs is hardly detectable (pink arrowheads). Scale bar 7,5 μm (B) Quantification of the ratio of DE-cad and Crb accumulation at LCJs and TCJs for each embryo analysed. Note that while DE-cad ratio is close to 1, indicating an equal fluorescence intensity at all cell junctions, Crb ratio indicates increased fluorescence intensity in LCJs. n = 254 LCJs and n = 314 TCJs from 15 wild type embryos. (C) Stills from a time-lapse movie of the accumulation of Crb in the DT (using CrbGFP, a viable knock-in allele that provides the only source of Crb protein in the embryo) in an otherwise wild type background. Note the enrichments of Crb in LCJs (red arrows) at different time points (in minutes) during stage 16. Time point 0' corresponds to an embryo at the end of stage 15. Note also the increase in tube length during 1:30 h and the moderate increase in diameter. Scale bar 5 μm (D) The Mobile fraction, Mf, was calculated and compared for LCJs and TCJs experiments. Mf was significantly higher at LCJs than at TCJs. Error bars indicate standard error (s.e.).(E) Comparison of the average fit from the different FRAP experiments of normalised post-bleach recovery in LCJs and TCJs. Note the higher recovery at LCJs. Error bars indicate standard deviation (s.d.). n = 8 LCJs and n = 6 TCJs from CrbGFP embryos.

