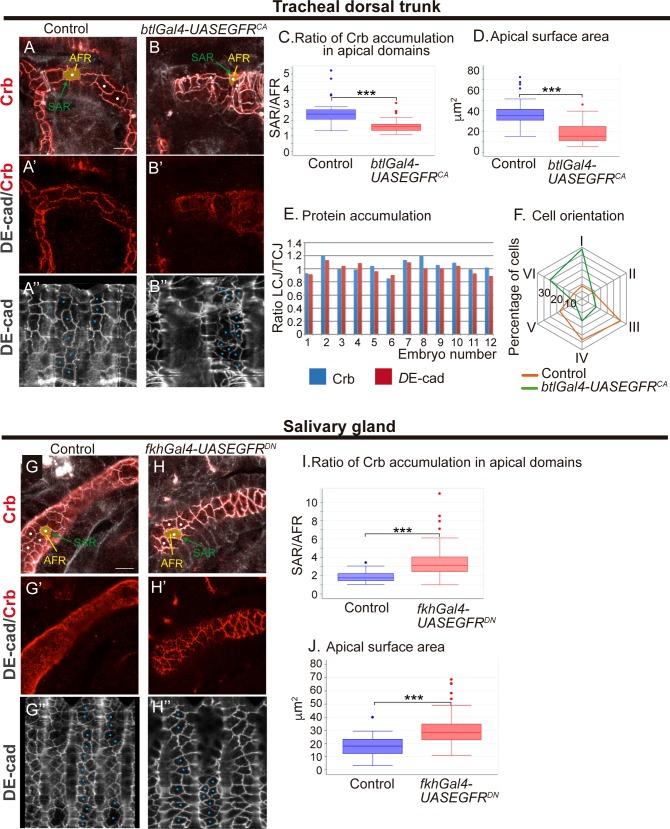
Fig 4. The subcellular localisation of Crb in apical domains correlate with apical expansion.
(A,B) Lateral views showing a region of the DT of stage 16 embryos of indicated genotypes stained for the indicated markers. Images correspond to a single confocal section or to a projection of 2–3 sections to include all the apical domain of selected cells (marked with a white dot). The SAR outlines the cell contours and the AFR fills the cell space inside the SAR. (A',B') Note the poor enrichment of Crb in the SAR when EGFR is constitutively activated. (A'',B'') Tubes were unfolded and DE-cad staining was used to follow the junctional domain in order to measure the apical surface area in selected cells (blue dots). Scale bar 7,5 μm (C) Quantification of the ratio of Crb accumulation in the different apical regions (as published in [20]). n = 25 cells from 8 control embryos, n = 53 cells from 7 EGFRCA embryos (D) Quantification of the cell area of the apical region. n = 46 cells from 5 control embryos, n = 71 cells from 5 EGFRCA embryos (E) Quantification of the ratio of DE-cad and Crb accumulation at LCJs and TCJs for each embryo analysed. Note that Crb and DE-cad ratio is close to 1, indicating a similar intensity at all cell junctions. n = 163 LCJs and n = 160 TCJs from 12 EGFRCA embryos. (F) Represents the orientation of DT cells. The radial chart indicates the proportion of cells included in intervals I-VI. In interval I cells are oriented from 0 to 30 degrees; in interval II from 30°-60°; in interval III from 60°-90°; in interval IV from 90°-120°; in interval V from 120°-150° and in interval VI from 150°-180°. Note the different orientation of DT cells in control and EGFRCA conditions (G,H) Lateral views showing a region of the salivary gland of stage 16 embryos of indicated genotypes stained for the indicated markers. Images correspond to a single confocal section or to a projection of 2–3 sections to include all the apical domain of selected cells (marked with a white dot). Note that in control embryos Crb is not particularly enriched in the SAR (G'). In contrast, when EGFR is downregulated (H') Crb clearly relocalises and accumulates in the SAR. (G'',H'') Salivary glands were unfolded and DE-cad staining was used to follow the junctional domain in order to measure the apical surface area in selected cells (blue dots). Scale bar 10 μm (I) Quantification of the ratio of Crb accumulation in the different apical regions. n = 30 cells from 7 control embryos, n = 67 cells from 9 EGFRDN embryos (J) Quantification of the area of the apical region. n = 69 cells from 6 control embryos, n = 60 cells from 5 EGFRDN embryos.

