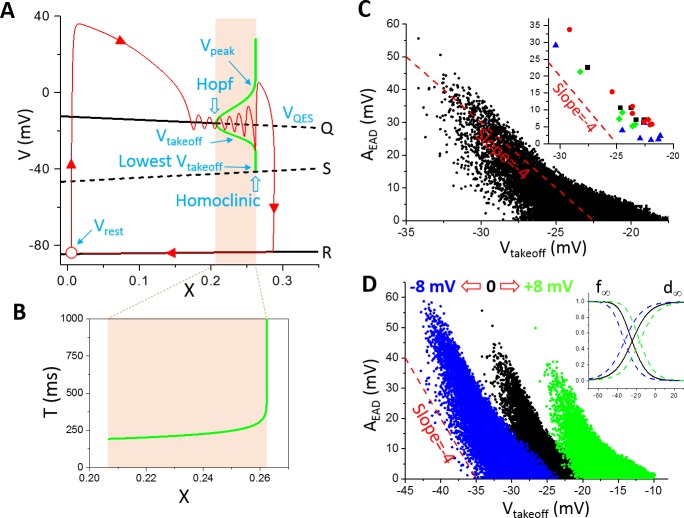
Fig 2. Bifurcation and EAD amplitude in the LR1 model.
A. Bifurcations in the fast subsystem when treating the slow subsystem (X) as a parameter. Q, S, and R are the three equilibria in the fast subsystem. The green bell-shaped envelope is the steady state oscillation amplitude (from Vtakeoff to Vpeak) from the Hopf bifurcation point to the homoclinic bifurcation point. The lowest possible takeoff potential is at the homoclinic bifurcation point, which is around -41.5 mV. The red trace (arrows indicate the time course) is an AP from the whole system where X is a variable. Open red circle is the resting state. Note: the bifurcations and simulations shown in this panel and panel B were done without the presence of INa. B. The steady-state oscillation period from the Hopf bifurcation point to the homoclinic bifurcation point. C. AEAD versus Vtakeoff. The parameters were randomly drawn from the assigned intervals as described in Methods. For each parameter set, the amplitudes of all EADs in the AP were included. The inset shows representative AEAD versus Vtakeoff from individual APs distinguished by colors. D. Same as C but for shifted Isi kinetics (d∞ and f∞). The green data points are for d∞ and f∞ shifted 8 mV toward more negative voltages and the blue ones are for d∞ and f∞ shifted 8 mV toward more positive voltages. The inset shows the corresponding shifts. Panels A and B were replots from Tran et al [12]. The dashed straight lines in C and D are references for slopes.

