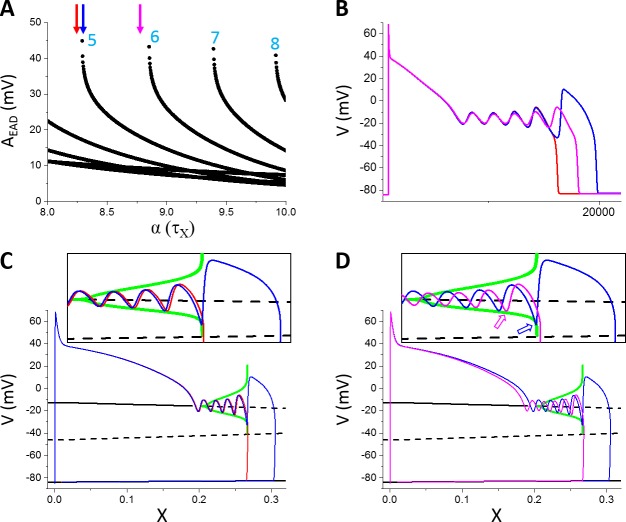
Fig 4. Linking the dual Hopf-homoclinic bifurcation to the EAD amplitude behavior.
A. AEAD versus fold change (α) of τX. B. APs correspond to the parameters indicated by the arrows with the same colors. Red: α = 8.24; Blue: α = 8.29; Magenta: α = 8.78. C. Bifurcation in the fast subsystem, the same as in Fig 2A except that INa was present. The blue and red traces are V versus X for the corresponding blue and red APs in B. Inset is the blowup of the EAD window. D. Same as C but for the blue and magenta APs in B. Open arrows in the inset mark the takeoff location of the 5th EAD with respect to the homoclinic bifurcation point. Note that both APs exhibit 5 EADs but the ones in the magenta AP take off at smaller X values.

