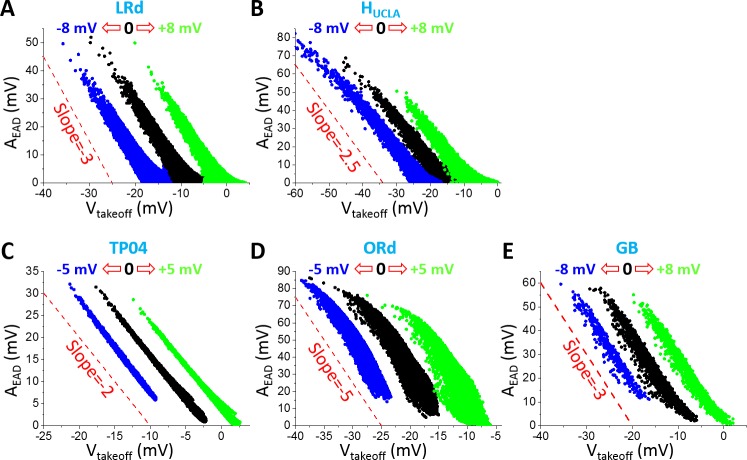
Fig 5. AEAD versus Vtakeoff in the physiologically more detailed models.
A. LRd. B. HUCLA. C. TP04. D. ORd. E. GB. Parameters were randomly drawn from assigned intervals (as described in Methods). AEAD was measured for all EADs in an AP. Black dots are AEAD for control steady-state activation and inactivation curves of ICa,L; blue dots are for both curves being shifted toward negative voltage; and green dots are for both curves being shifted toward more positive voltages. The voltage shifts are indicated by the open arrows in each panel in the same way as in Fig 2D. Dashed lines are reference lines for the slopes.

