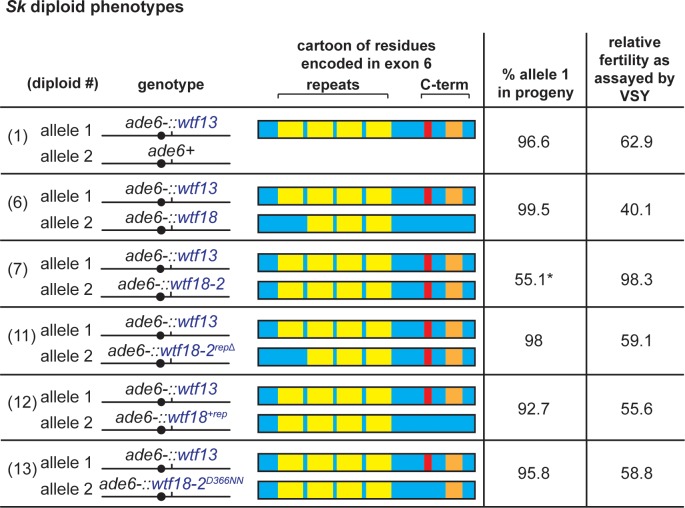
Fig 3. Mutations in exon 6 alter specificity between the Sp wtf13 driver and the Sp wtf18-2 suppressor.
A cartoon of the C-terminal region, allele transmission and fertility of Sk diploids is shown. In the cartoon, the yellow boxes depict the number of repeat units for each allele. The red and orange boxes depict the differences between the residues at the most C-terminal region of the proteins. The diploid numbers carry over between Figures, meaning that the data for diploids 1, 6 and 7 are repeated from Fig 2. To detect if the different alleles generated still had the ability to suppress the drive phenotype, diploids 6, 7, 11–13 were compared to diploid 1. Fertility was normalized to the wild-type control (Fig 2, diploid 10). More than 200 haploid spores were genotyped for each diploid. * indicated p-value < 0.05 (G-test [allele transmission]). None of the fertility values were significantly different compared to the control (diploid 1). All raw data can be found in S1 and S2 Tables.

