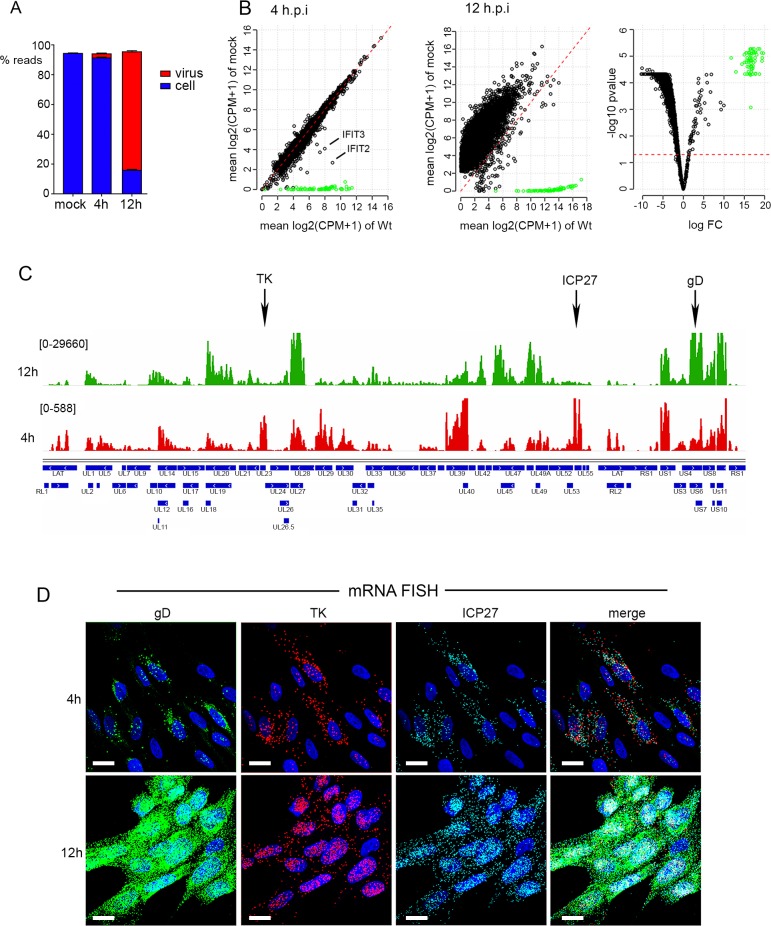
Fig 2. Dual transcriptomic analysis of human fibroblast cells infected with HSV1.
HFFF cells were left uninfected, or infected with HSV1 (s17) at a multiplicity of 2. At 4 or 12 h.p.i., total RNA was purified and used for library preparation followed by sequencing. A total of 5 biological replicates were sequenced for each condition. (A) The proportion of reads mapped in each condition to either the human (blue) or HSV1 (red) transcriptome. (B) Differential expression analysis of cell and virus transcripts was conducted using EdgeR as described in Methods. Differences in the number of reads mapped to cell (black circles) and virus (green circles) transcripts were plotted as scatter plots comparing results at 4 and 12 hours to uninfected cells. The red dashed line is the line of identity (1:1) representing no change in the transcript levels between each condition. The 12 h results are also represented in a volcano plot indicating the high level of significance for the detected changes (right hand panel, where the red dashed line denotes a p-value of 0.05). (C) The reads obtained for the virus transcriptome were mapped to the virus genome for 4 (red) and 12 (green) hours. Numbers in parentheses represent maximum read counts per million obtained in each condition. The location of the TK, ICP27 and gD genes are indicated by arrows. (D) HFFF cells grown in slide chambers were infected with HSV1 (s17) at a multiplicity of 2 fixed at 4 or 12 h, and subjected to multiplex mRNA FISH with probes to genes representing IE (ICP27 in cyan), E (TK in red) and late (gD in green) transcripts. Nuclei were counterstained with DAPI (blue). Scale bar = 20 μm.

