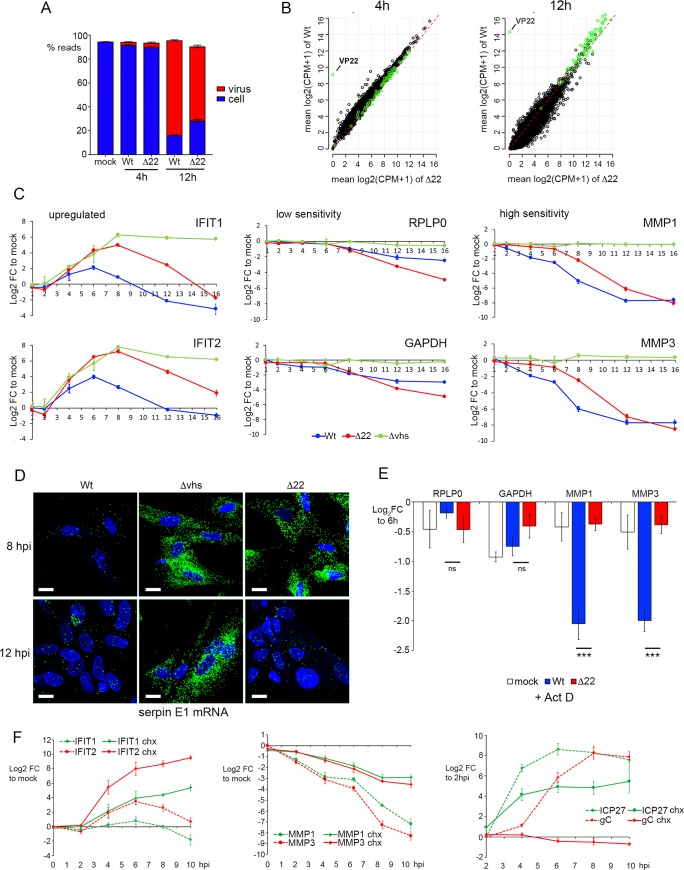
Fig 4. Vhs activity against cellular transcripts is delayed in Δ22 infected HFFF cells.
(A) & (B) Dual transcriptomic analysis of HFFF cells infected with the Δ22 virus at a multiplicity of 2 was carried out alongside the analyses presented in Fig 2. (A) Proportion of reads mapped in each condition to either the human (blue) or HSV1 (red) transcriptome. (B) Differential expression analysis of cell and virus transcripts comparing Wt (y-axis) to Δ22 (x-axis) at 4 and 12 h after infection. Differences in the number of reads mapped to cell (black circles) and virus (green circles) transcripts were plotted as scatter plots. The red dashed line is the line of identity (1:1) representing no change in the transcript levels between each condition. (C) HFFF cells were infected with Wt, Δ22 or Δvhs viruses at a multiplicity of 2, and total RNA was harvested at the indicated times (in hours). qRT-PCR was carried out for the indicated cell transcripts. Transcript levels are expressed as the log2 FC to mock (ΔΔCT) over time. The mean and ± standard error for n = 3 is shown. (D) HFFF cells were infected with Wt, Δ22 or Δvhs viruses at a multiplicity of 2 were fixed at 8 or 16 hours after infection and processed for mRNA FISH with a probe specific for the cellular transcript for serpin E1. Nuclei were counterstained with DAPI. Scale bar = 20 μm. (E) HFFF cells were infected with Wt HSV1 at a multiplicity of 2. At 6 hours, the cells were either harvested for total RNA, or actinomycin D (5 μg/ml) was added and the infection left for a further 4 hours before harvesting total RNA. qRT-PCR was carried out on all samples for the indicated cell transcripts, with results expressed as the log2 FC to the sample harvested at 6 hours (ΔΔCT). The mean and ± standard error for n = 3 is shown. Statistical analysis was carried out using an unpaired, two-way student’s t test. ns, p > 0.05. ***, p < 0.001. (F) HFFF cells were pre-treated in the absence or presence of cycloheximide (100 μg/ml) for 1 hour prior to infection with Wt HSV1 at a multiplicity of 2. Total RNA samples were purified at the indicate times and subjected to qRT-PCR for upregulated transcripts (IFIT1 and IFIT2), hypersensitive transcripts (MMP1 and MMP2) and virus transcripts (ICP27 and gC). For cell genes, the transcript levels are expressed as the log2 FC to mock, and for virus genes they are expressed as log2 FC to 2 hours. The mean and ± standard error for n = 3 is shown.

