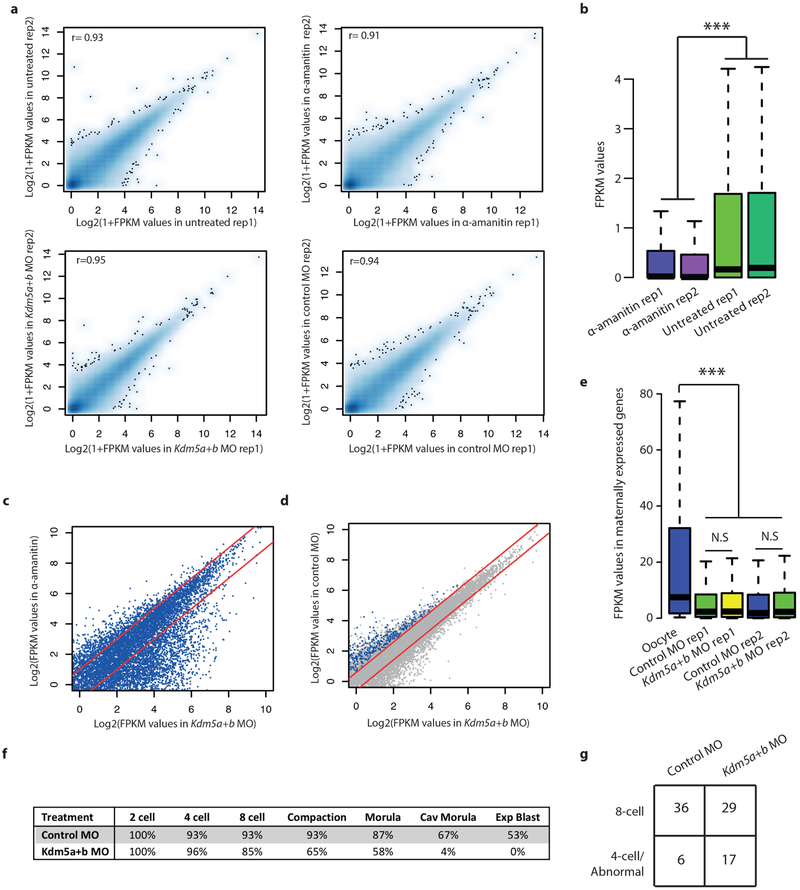
Extended Data Figure 10 |. RNA-seq analysis of KDM5A and KDM5B depleted 2-cell embryos.
a, Scatter plots show FPKM values of GENCODE annotated genes (each dot, n = 32,287) between two biological replicates for four different conditions. Pearson correlation coefficient values are also shown. b, Box plots show the effect of α-amanitin treatment on transcriptional inhibition (Kolmogorov-Smirnov test P < 2.2−16). c, Scatter plots show FPKM values of GENCODE annotated genes (each dot, n = 32,287) between Kdm5a and Kdm5b morpholino (Kdm5a+b MO)-injected embryos (x axis) and α-amanitin-treated embryos (y axis). We present log2-transformed average FPKM values from two biological replicates. Red lines indicate twofold up- or downregulation. d, Scatter plots show FPKM values of GENCODE annotated genes between Kdm5a+b MO injected embryos (x axis) and control MO injected embryos (y axis). We present log2-transformed average FPKM values from two biological replicates. Red lines indicate 1.5-fold up- or downregulation. Grey, all genes; blue, downregulated ZGA genes. e, Box plots are shown for FPKM values of maternally expressed genes in oocyte, Kdm5a and Kdm5b morpholino replicates, and control morpholino replicates. NS indicates non-significant P value from one-sided paired t-test. In 2-cell embryos maternally expressed genes are significantly down regulated in both Kdm5a and Kdm5b morpholino and control morpholino injected embryos (P values <2.2−16, Kolmogorov-Smirnov test). Whiskers correspond to the highest and lowest points within the 1.5 × interquartile range (b, e). f, Rate of development to various embryonic stages for Kdm5a and Kdm5b morpholino injected and control morpholino injected embryos resulting from natural mating (control MO, n =15; Kdm5a+b MO, n = 26). g, Number of embryos at the 8-cell and 4-cell or abnormal stage in Kdm5a+b MO (n = 46) and control MO (n = 42) (Fisher’s exact test P = 0.028, odds ratio = 3.5), for in vitro fertilized embryos for the experiment shown in Fig. 5c.

