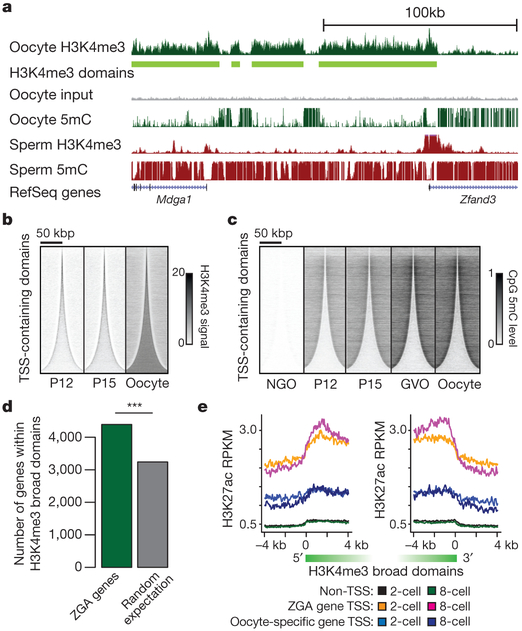
Figure 3 |. Relationships between broad H3K4me3 domains, DNA methylation and ZGA.
a, Genome browser snapshot of H3K4me3 signal and DNA methylation levels for oocyte and sperm19,23. b, c, Heat maps of H3K4me3 and DNA methylation for indicated oocyte stages at TSS-containing domains ordered according to increasing sizes (n = 15,608). Horizontal positions, spatial distribution relative to domain centre; Densities, H3K4me3 signal (b) or CpG methylation level (c). d, Bar plot showing number of ZGA genes embedded within broad H3K4me3 domains and the number expected by chance (***P < 10−3, Fisher’s exact test). e, Average H3K27ac RPKM values of 5’ and 3’ sides and flanking regions of broad H3K4me3 domains in 2- and 8-cell-stage embryos for ZGA gene TSS-containing domains (n = 2,104), oocyte-specific gene TSS-containing domains (n = 1,117) and non-TSS-containing domains (n = 12,691) broader than 10 kb. Domains containing both ZGA and oocyte-specific gene TSSs were excluded.

