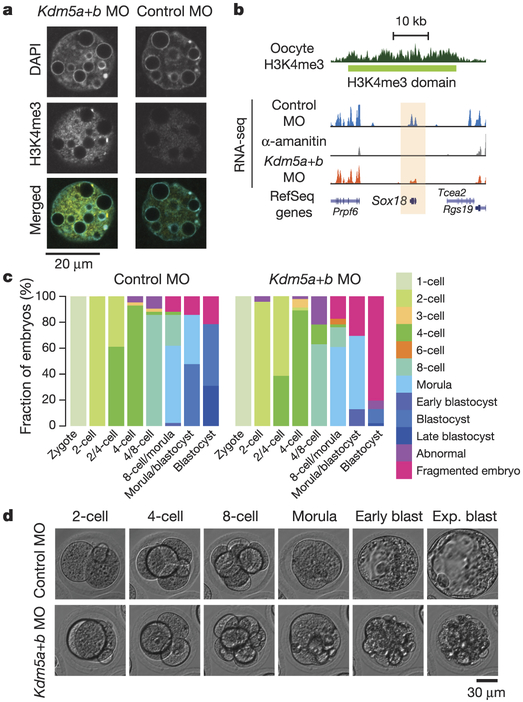
Figure 5 |. KDM5A and KDM5B remove broad H3K4me3 domains.
a, Confocal laser scanning micrographs showing H3K4me3 levels in late 2-cell stage embryos after injection with morpholinos targeting Kdm5a and Kdm5b (Kdm5a+b MO), or 5-base mismatch control morpholinos (control MO). H3K4me3 (yellow) and DNA (DAPI, cyan). b, Genome browser snapshot is shown for Sox18 gene expression levels for Kdm5a+b MO, control morpholinos, and α-amanitin treated embryos. c, Stacked bar plots show fraction of embryos at different developmental stages after injection with morpholinos targeting Kdm5a and Kdm5b (right side, n = 46), or control morpholinos (left side, n = 42). d, Representative images of abnormal development in Kdm5a+b MO injected embryos, compared with normal development in control morpholino embryos. Blast, blastocyst; exp. blast, expanded blastocyst.

