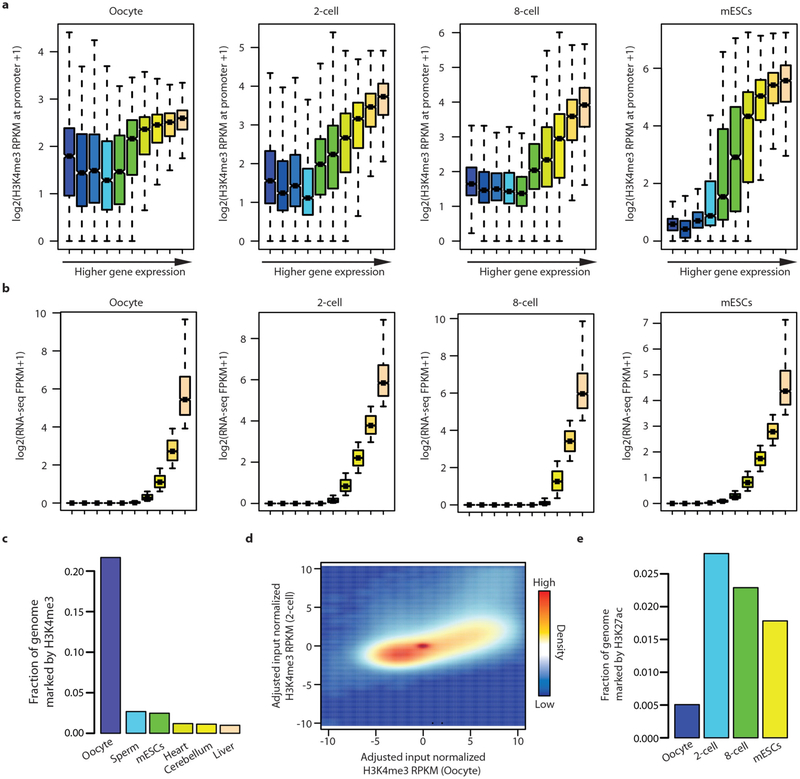
Extended Data Figure 3 |. Relationship between promoter H3K4me3 and expression.
a, Box plots for H3K4me3 RPKM values at promoter regions after grouping promoters into 10 equally sized groups according to gene expression levels. b, Box plots for gene expression levels for each group are shown. Whiskers correspond to the highest and lowest points within the 1.5 × interquartile range (a, b). c, Fraction of the mouse genome covered by H3K4me3 peaks at different developmental stages and in various adult tissues26. H3K4me3 peaks were defined using default MACS2 peak call settings except for oocyte. Oocyte H3K4me3 peaks were defined using MACS2 broad peak call settings. d, Scatter plot of H3K4me3 signals in 1kb bins between oocyte and 2-cell-stage embryos. Genomic regions marked with a strong H3K4m3 signal in the oocyte show reduced signal in 2-cell-stage embryos. e, Fraction of the mouse genome covered by H3K27ac peaks using default MACS2 peak call settings for different developmental stages.

