
Figure 1:
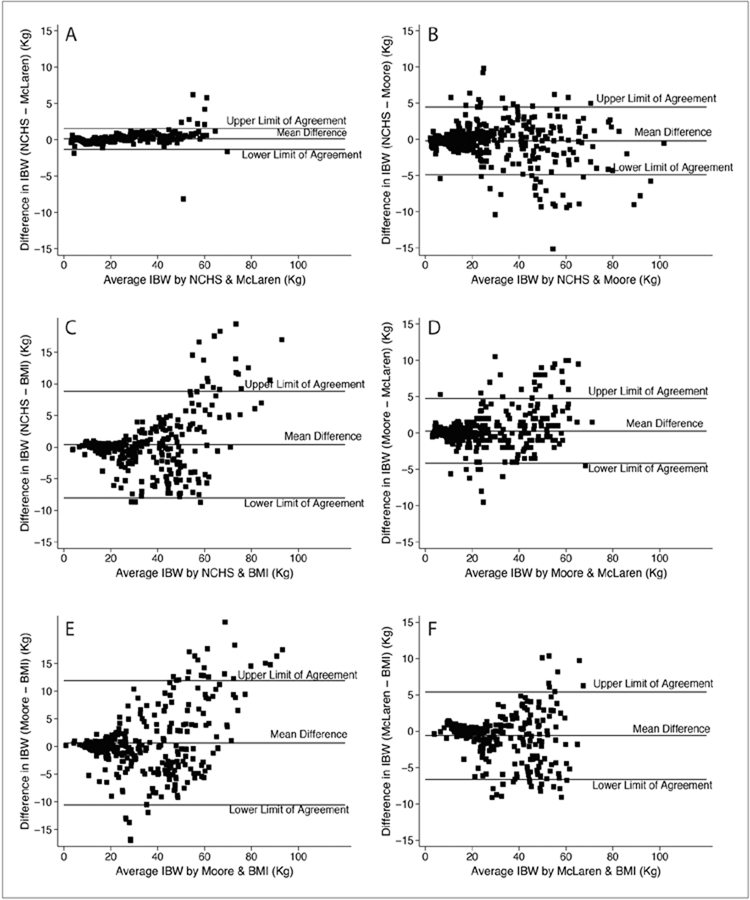
Bland-Altman plots comparing each of the 4 IBW methods to each other for the whole cohort. There comparison are as follows: NCHS to McLaren (A), NCHS to Moore (B), NCHS to BMI (C), Moore to McLaren (D), Moore to BMI (E), McLaren to BMI (F). A comparison with good agreement between the methods has a narrow range between upper and lower levels of agreement and few subjects outside the limits of agreement.