
Figure 6.
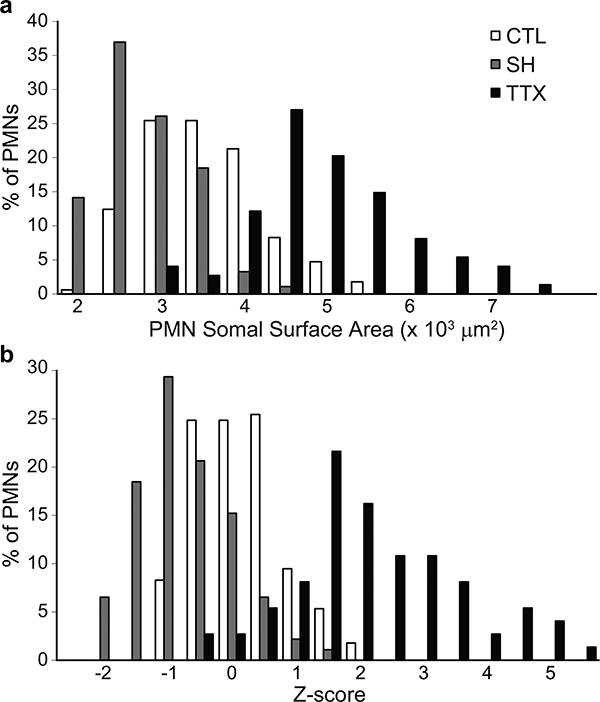
Phrenic motoneuron somal surface area was different across groups. (a) Distribution of phrenic motoneuron surface areas in control, SH and TTX animals. (b) Distribution of Z-scores for somal surface areas in control, SH and TTX animals. Note the leftward shift in surface area distribution with SH, indicating a decrease in the surface area of larger phrenic motoneurons. In contrast, with TTX, the distribution is shifted to the right.