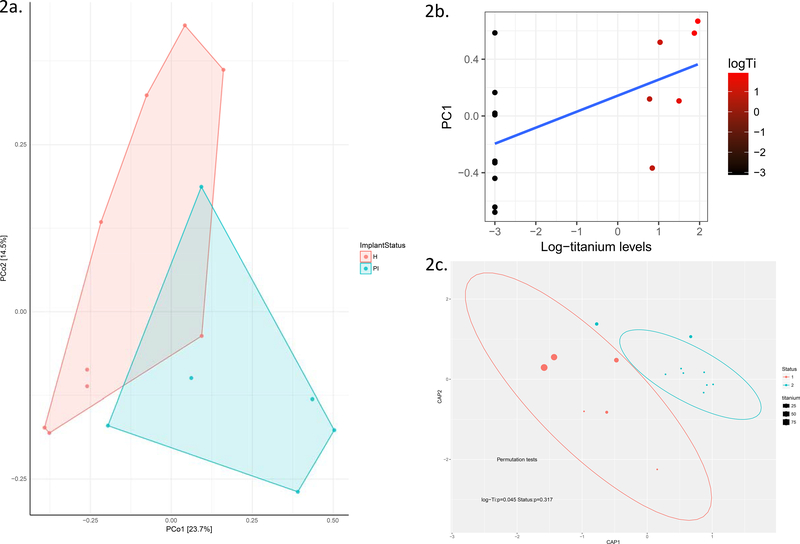
Figure 2:
Principal coordinates of the microbiome in healthy implants (orange) and peri-implantitis (green). Note the overlap of healthy and diseased implant sites when plotted on the first two principal coordinates of the microbiome (2a). Scatterplot of titanium levels (log-transformed) versus the first principal component of the microbiome (2b). Canonical Analysis of principal coordinates showing titanium levels per site in embedded bubble plots in healthy implants (orange) and peri-implantitis (green) showing a clear separation between health and disease according to Ti presence in plaque (2c).

