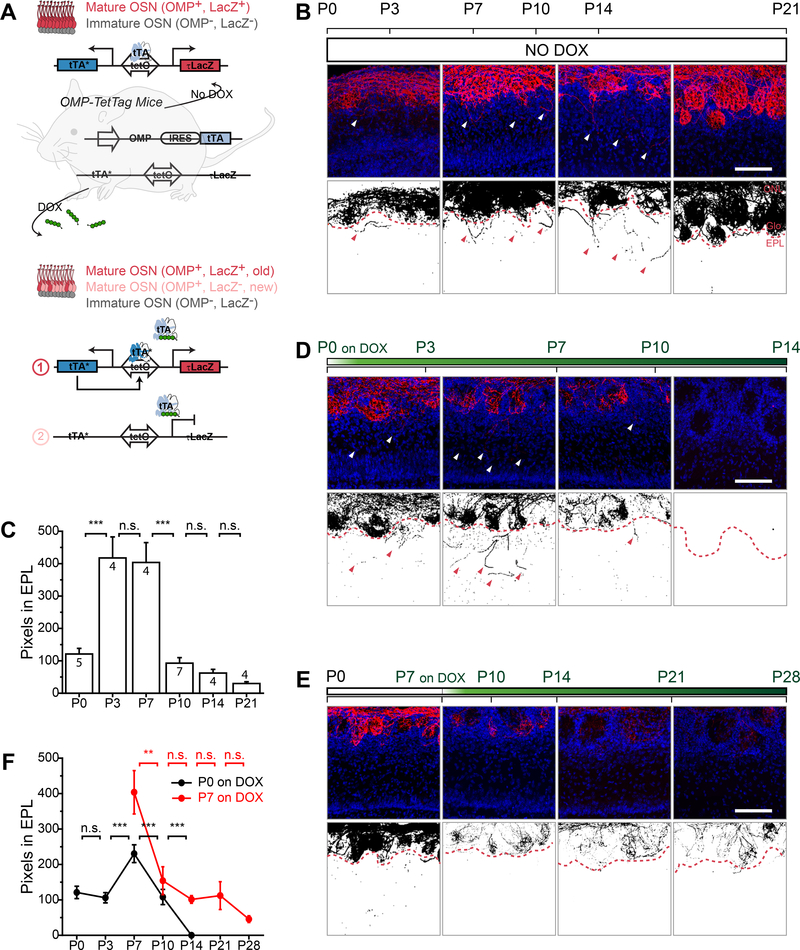
Figure 2. Chronogenetic labeling of OSNs reveals exuberant axon projection during critical period.
A. Schematic illustration of labeling OSNs with Omp-TetTag method. In the absence of DOX, OMP+ mOSNs are labeled with LacZ (red). When mice are fed with DOX diet, mOSNs that are OMP+ (red) before DOX treatment will maintain LacZ expression via persistent activity of tTA*. New mOSNs (pink) that become OMP+ after DOX treatment will not express LacZ. B, D and E. Representative images of olfactory bulb sections of Omp-TetTag mice fed with regular diet (B), DOX diet at P0 (D), and DOX diet at P7 (E). Upper panels, sections are stained with anti-βgal antibodies (red) and DAPI (blue). Lower panels, binary images of signals from anti-βgal staining. Arrow heads indicate exuberant axons invading the EPL. Red dashed line indicates the boundary between the glomerular layer and the EPL. C. Quantification of exuberant OSN axons in the EPL in mice fed with regular diet. The bar plot indicates the number of red pixel (LacZ staining) in the EPL. The number of bulbs analyzed are indicated for each bar. The bars represent mean ± SEM with p-values calculated from one tail Student’s t-test. ***, p < 0.001; n.s., not significant. F. Quantification of exuberant OSNs axons in the EPL in mice fed with DOX diet at P0 (black) and P7 (red). The scatter plot indicates the number of red pixel (LacZ staining) in the EPL. Each dot represents mean ± SEM. **, p < 0.01, ***, p < 0.001; n.s., not significant, one tail Student’s t-test. Scale bar, 100 μm. ONL, olfactory nerve layer. Glo, glomeruli layer. EPL, external plexiform layer.

