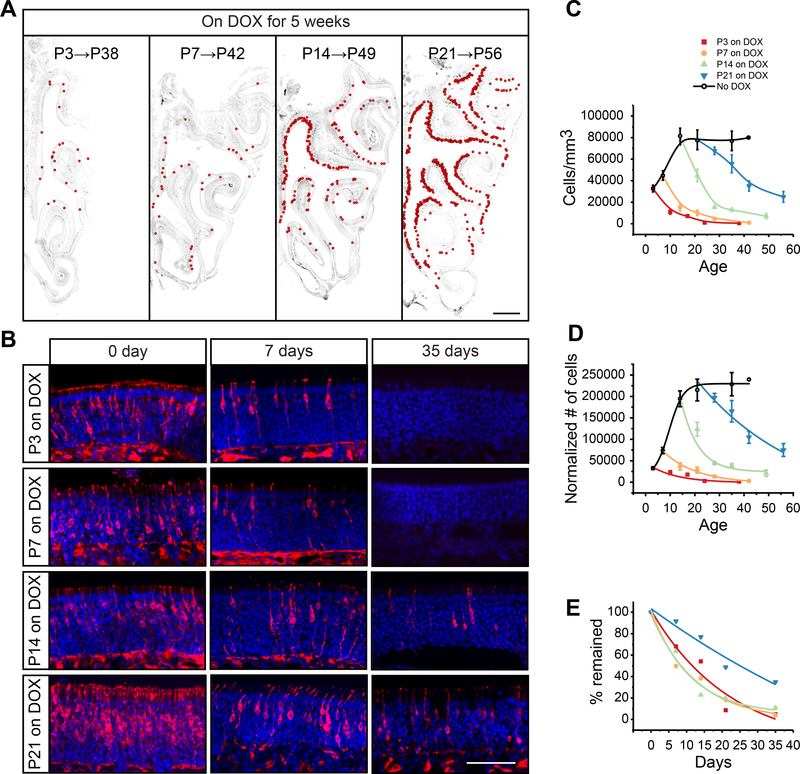
Figure 4. Tracking OSN lifespan with Omp-TetTag labeling.
A. Coronal sections of the nose through the turbinate. Omp-TetTag mice are fed with DOX diet during indicated time periods. Sections are stained with antibodies against βgal (gray). Each red circle indicates a LacZ+ OSN with clearly identifiable cell body and a dendrite. Scale bar, 500 μm. B. Representative images of neuroepithelia from DOX fed animals. Sections are stained with antibodies against βgal (red) and DAPI (blue). Omp-TetTag mice are fed with DOX diet starting at indicated ages. The number of days on DOX treatment is shown at the top. Scale bar, 50 μm. C and D. Quantification of labeled OSN in Omp-TetTag mice. The number of LacZ+ OSNs per mm3 (C) and the number of LacZ+ OSNs normalized to P3 (D) are plotted as a function of the age of the animals. Sigmoidal (black) and exponential decay (other colors) fittings are performed. E. Percentage of LacZ+ cells plotted as the function of the duration of DOX treatment. The initial value of cell number is set to 100% for each group. C-E. Mice are treated with either no DOX (black open circle), DOX at P3 (red square), P7 (orange filled circle), P14 (green triangle), or P21 (blue inverted triangle).

