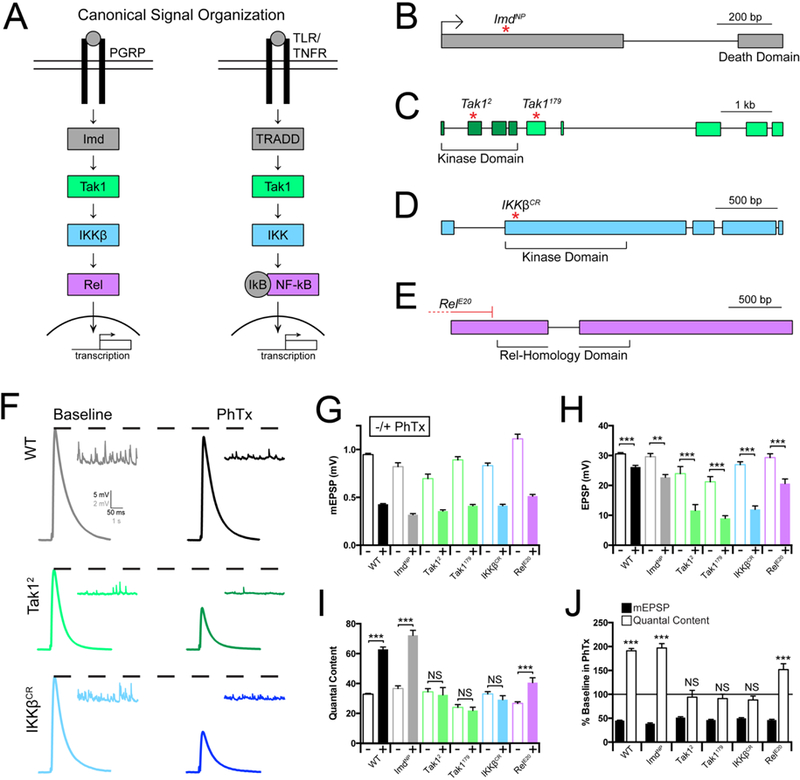
Figure 1. Innate immune signaling during the rapid induction of PHP.

(A) Diagram of the Drosophila melanogaster Immune Deficient (IMD) pathway and homologous mammalian innate immune signaling. (B-E) Gene loci for Imd, Tak1, IKKβ, and Rel, with genetic reagents indicated. (F) Representative traces for EPSP (scale, 5 mV, 50 ms) and mEPSP (scale, 2 mV, 1 s) at baseline, and in the presence of philanthotoxin (PhTx) for the indicated genotypes. (G) Average mEPSP amplitude for each genotype in the absence (light bars) or presence (dark bars) of PhTx. (H) Average EPSP amplitude in the absence (light bars) or presence (dark bars) of PhTx. (I) Average quantal content in the absence (light bars) or presence (dark bars) of PhTx. (J) mEPSP amplitudes (filled bars) and quantal content (open bars) for each genotype in the presence of PhTx, normalized to baseline values in the absence of PhTx. Data are presented as average (+/− SEM) and statistical significance determined by Student’s t-test (unpaired, two-tailed). See also Supplemental Figures 1 and 3.
