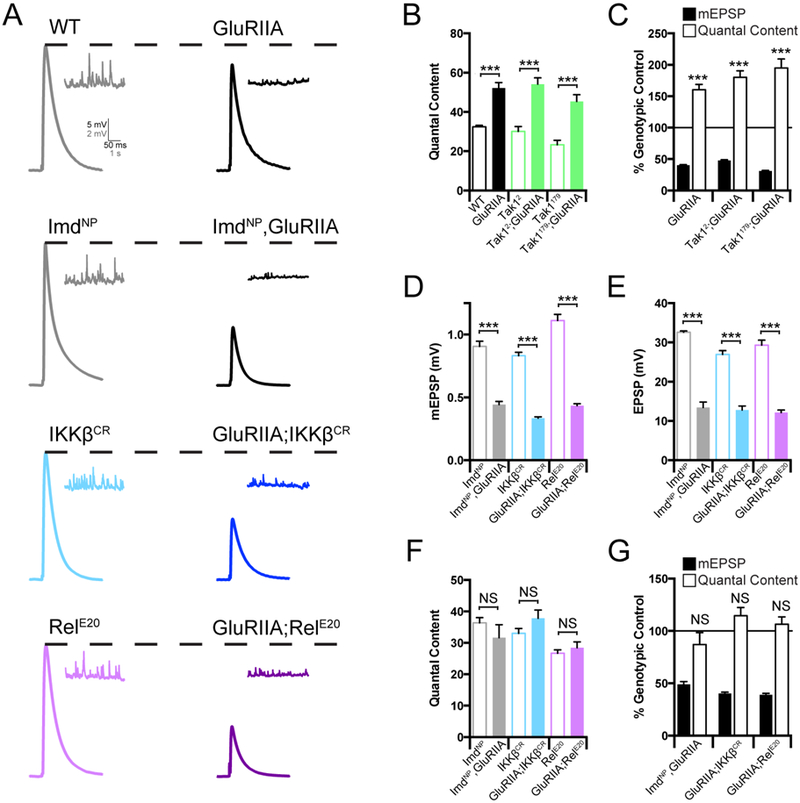
Figure 2. Innate immune signaling during the sustained expression of PHP.

(A) Representative traces for EPSP (scale, 5 mV, 50 ms) and mEPSP (scale, 2 mV, 1 s) at baseline, and in the background of the GluRIIA mutation, for the indicated genotypes. (B) Average quantal content for each genotype in the absence (open bars) or presence (filled bars) of the GluRIIA mutation. (C) mEPSP amplitudes (filled bars) and quantal content (open bars) for each genotype in the GluRIIA background, normalized to the control genotype in the absence of GluRIIA. (D) Average mEPSP amplitude for each genotype in the absence (open bars) or presence (filled bars) of the GluRIIA mutation. (E) Average EPSP amplitude for each genotype in the absence (open bars) or presence (filled bars) of the GluRIIA mutation. (F) Average quantal content in the absence (open bars) or presence (filled bars) of the GluRIIA mutation. (G) Average mEPSP and quantal content normalized to genotypic controls as in C. Data are presented as average (+/−SEM) and statistical significance determined by Student’s t-test (unpaired, two-tailed). See also Supplemental Figure 2.
