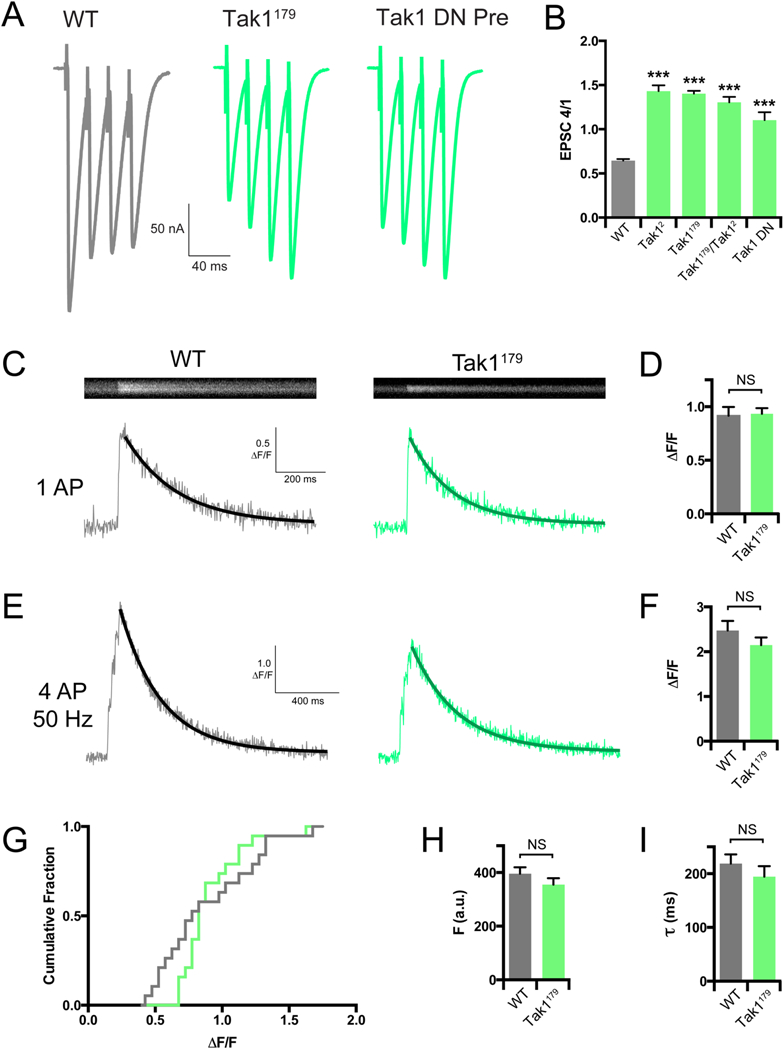
Figure 5. Tak1 functions downstream of action-potential induced presynaptic calcium influx.

(A) Representative traces for EPSC trains (scale, 50 nA, 40 ms). Stimulation frequency was 50 Hz, and extracellular calcium concentration was 1.5 mM. UAS-Tak1DN was expressed presynaptically with OK371-GAL4. (B) Average ratio of EPSC #4 in the train divided by EPSC #1 for the indicated genotypes. (C) Representative line scans and calcium transients (scale, 0.5 ΔF/F, 200 ms) for WT (grey bar) and Tak1179 (green bar). (D) Average ΔF/F for the indicated genotypes. (E) Representative calcium transients (scale, 1 ΔF/F, 400 ms) for the indicated genotypes. Stimulation was identical to that used in F. (F) Average ΔF/F for the indicated genotypes. (G) Cumulative frequency distributions of ΔF/F for WT (grey line) and Tak1179 (green line). (H) Average baseline fluorescence as a measure of dye-loading for the indicated genotypes. (I) Average decay constants of the transients in H and I for the indicated genotypes. Data are presented as average (+/− SEM) and statistical significance determined by Student’s t-test (unpaired, two-tailed) (D-I) or by one-way ANOVA with Tukey’s multiple comparisons test (B).
