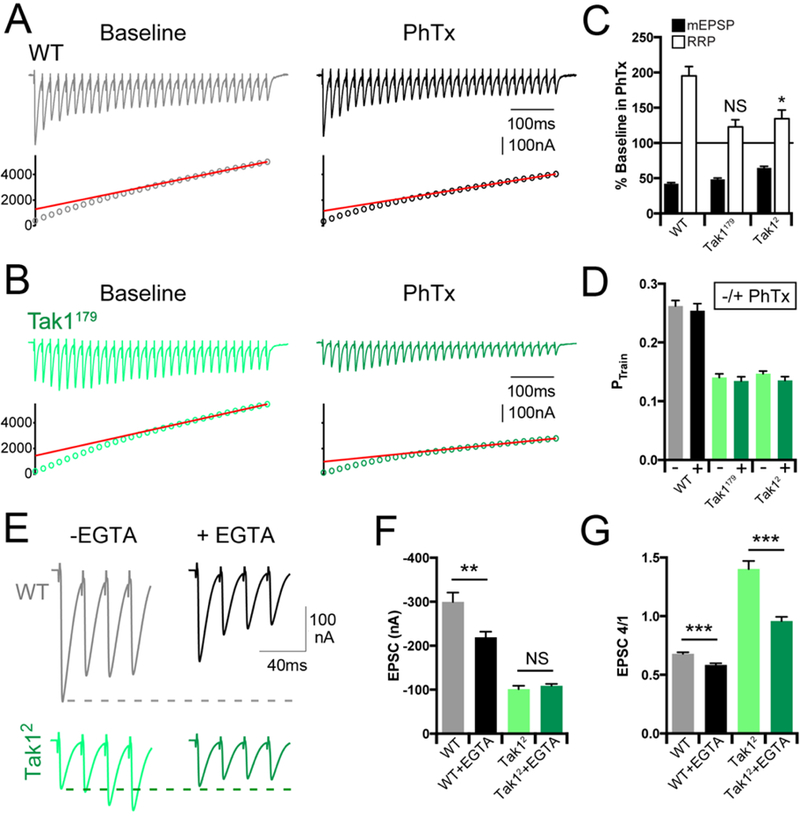
Figure 6. Tak1 controls the homeostatic modulation and dynamics of the readily releasable pool.

(A, B) Representative EPSC trains (scale, 100 nA, 100 ms) at baseline, and in the presence of PhTx, for the indicated genotypes. Trains are 30 stimuli delivered at 60 Hz. Extracellular calcium concentration is 3 mM. (C) Average data for mEPSP amplitudes (filled bars) and readily releasable pool size (open bars) in the presence of PhTx, normalized to baseline, for the indicated genotypes. (D) Average data for probability of release calculated as PTrain = amplitude of the first EPSC divided by the cumulative EPSC in the indicated genotypes. (E) Representative EPSC traces (scale, 100 nA, 40 ms) at baseline (light traces), and after incubation with EGTA-AM (50 µM) (dark offset traces) for the indicated genotypes. (F) Average data for EPSC amplitude at baseline (light bars), and after incubation with EGTA-AM (dark bars) for the indicated genotypes. (G) Average data for the amplitude of the 4th EPSC in a train divided by the 1st EPSC in a train. Data are presented as average (+/− SEM) and statistical significance determined by Student’s t-test (unpaired, two-tailed).
