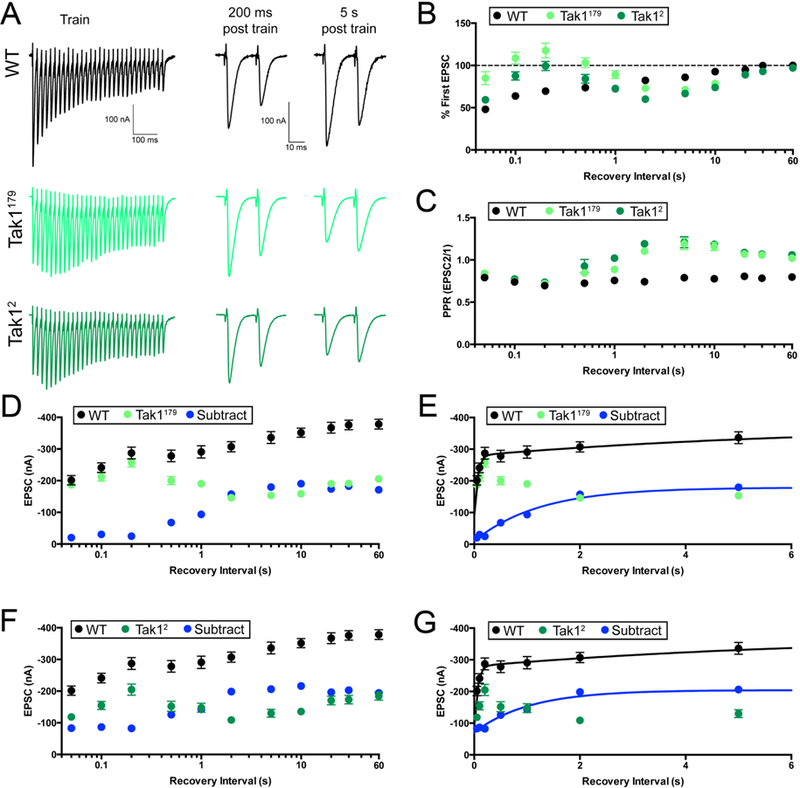
Figure 7. Tak1 stabilizes a high release probability synaptic vesicle pool.

(A) Representative traces for trains used to deplete the vesicle pool (scale, 100 nA, 100 ms), and paired EPSC pulses at recovery intervals of 200 ms and 5 s after the train (scale, 100 nA, 10 ms), for the indicated genotypes. (B) Summary data showing average recovery time courses in the indicated genotypes. (C) Average paired-pulse ratio, calculated as the amplitude of EPSC #2 divided by that of EPSC #1, at each recovery interval, for the indicated genotypes. Inter stimulus interval for paired pulse is 20 ms. (D) Average data for recovery time courses of raw EPSC amplitudes in the indicated genotypes. The data labeled “subtract” (blue) are calculated by subtraction of the average amplitude in Tak1179 from that of WT, at each tested recovery interval. (E) View of the first 6 seconds of the data presented in D, now plotted on a linear x axis. WT data are fit with a double-exponential function (τfast=0.053 s, τslow=6.25 s). Subtraction data could not be fit with a double-exponential function and are fit with a single exponential function (τ=1.23 s). Fits were calculated using all the data out to 90 s, but the x axis is limited to 6 s for ease of visualization. (F) Average data for recovery time courses of raw EPSC amplitudes in the indicated genotypes. WT data are repeated from D. “Subtract” was generated as in D, subtracting Tak12 amplitudes from WT. (G) View of the first 6 seconds of the data in F. Subtraction data are again fit with a single exponential function (τ=1.04 s). WT data are repeated from E. Data are presented as average (+/− SEM).
