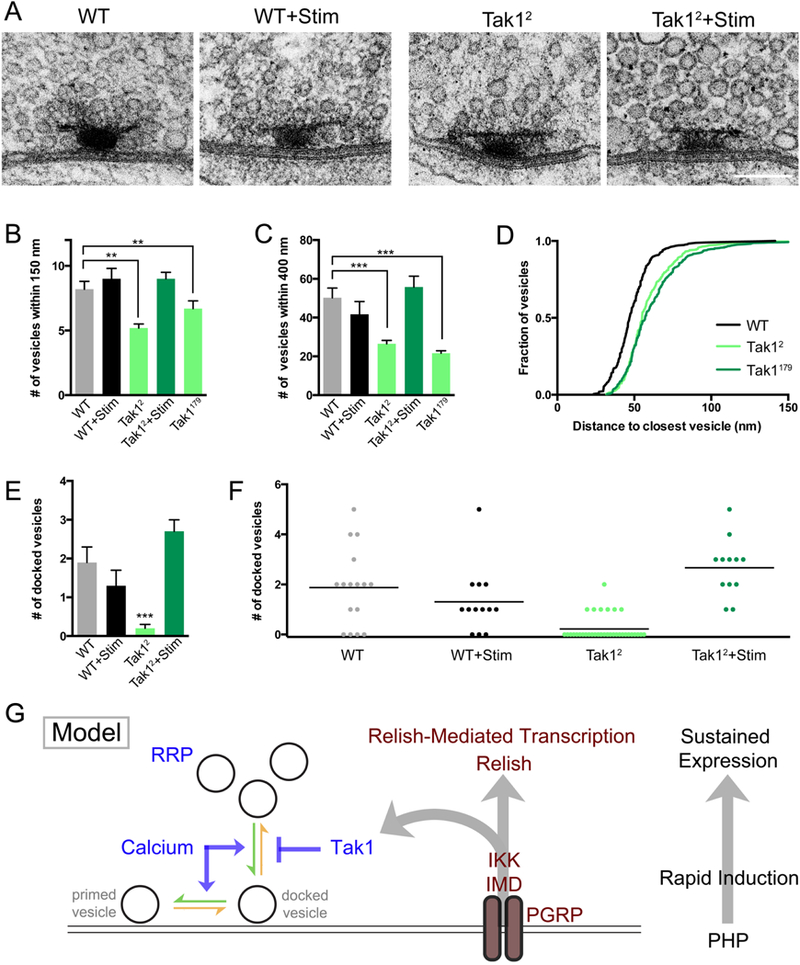
Figure 8. Impaired synaptic vesicle distribution and docking at the active zones of Tak1 mutants.

(A) Representative electron micrographs of presynaptic active zones in the indicated genotypes. Scale bar represents 100 nm. (B) Average number of vesicles within 150 nm of the base of the T-bar for the indicated genotypes. (C) Average number of vesicles within 400 nm of the base of the T-bar for the indicated genotypes. (D) Cumulative frequency distribution of the distance between each vesicle and its nearest neighboring vesicle for the indicated genotypes. (E) Average number of docked vesicles per active zone in the indicated genotypes. Only Tak12 is statistically different from wild type. Data are presented as average (+/− SEM) and statistical significance was determined by one-way ANOVA with Tukey’s multiple comparisons test. (F) Individual data points for number of docked vesicles in the indicated genotypes, re-plotted from (E) where statistical significance is indicated. Each dot represents one active zone. Line indicates the mean. (G) Model. At right: the IMD signaling cascade couples the mechanisms of rapid induction with the long-term expression of PHP. Center: diagram of the IMD signaling cascade initiated by the PGRP receptor, which catalyzes the assembly of the IMD complex inclusive of the proteins IMD, IKK and Tak1. Left: Tak1 inhibits the rate of vesicle un-docking (orange arrow) at an individual presynaptic release site. The opposing rate of vesicle docking is potentiated by intracellular calcium, among other factors. The readily releasable vesicle pool (RRP) is indicated.
