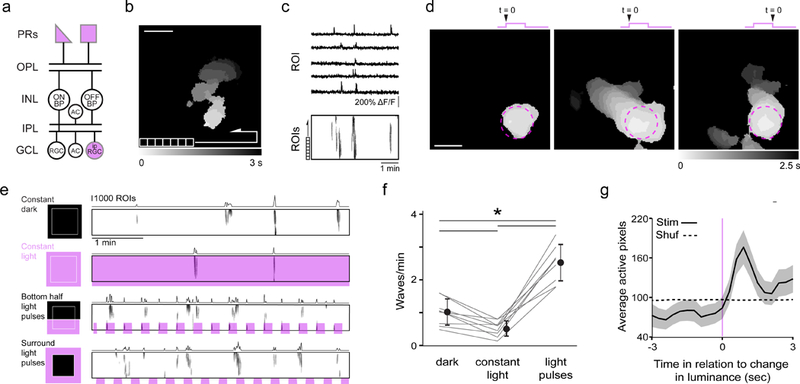
Figure 1. Light modulates the frequency of glutamatergic waves.

a. Schematic of retinal circuitry in P10–14 mice when glutamatergic waves occur. Purple indicates light-sensitive cells. OPL: outer plexiform layer; INL: inner nuclear layer; IPL: inner plexiform layer; GCL: ganglion cell layer; RGC: retinal ganglion cell; ipRGC: intrinsically photosensitive RGC; AC: amacrine cell.
b. Heat map representing the spread of a representative glutamatergic wave observed with two-photon calcium imaging in retina expressing GCaMP6f in synapsin-1 positive cells. For subsequent analysis, the field of view (FOV; 850 µm x 850 µm) is divided into a grid of 10,000 regions of interests (ROI). Scale bar = 200 µm.
c. (Top) Time course of the fractional change in fluorescence (∆F/F) for five example ROIs acquired at a frame rate of 3 Hz. (Bottom). Raster plots of neuronal Ca2+ transients > 15% ∆F/F for all ROIs. The total imaging duration is 5 minutes.
d. Examples of light stimulation of P12 retinas using a 200 µm diameter spot of 375 nm light within the FOV. The stimulation evoked light responses for neurons within the illuminated spot (purple dashed circle) but sometimes did not trigger a wave (left), or triggered a wave on the onset (middle) or the offset (right) of a light response.
e. Raster plots depicting retinal waves under four conditions: dark, constant light, light pulses across the bottom of the FOV, and light pulses surrounding the FOV. The sum of active ROIs is displayed above each raster plot. See Supplementary Movie 1. For subsequent analyses, the two light-pulse conditions were combined.
f. Summary data depicting mean ± SD wave frequency for dark, light, and pulsing light conditions. *: p < 0.001 Tukey’s HSD test, n = 9 retinas per group.
g. Waveform average depicting sum of ROIs ± SEM triggered around changes in luminance at P11–13 (black). Dotted line represents the same dataset randomly shuffled in time.
